SMA Forecast Calculator
Click here to get more Free Online Business Calculators.
Click here for more Supply Chain and Inventory Calculators.
How to Use the Simple Moving Average Forecast Calculator
- Step 1: Enter the number of periods you want to analyze. A period can be a day, month, or year, depending on your data.
- Step 2: Click "Set Periods" to generate the input fields.
- Step 3: Fill in the actual values for each period. Ensure to input the data sequentially from the first to the last period.
- Step 4: After entering at least three periods, the calculator will automatically display the forecast for the next period.
- Step 5: If you need to start over, simply click the "Reset" button to clear all fields and re-enter the new data.
Formula
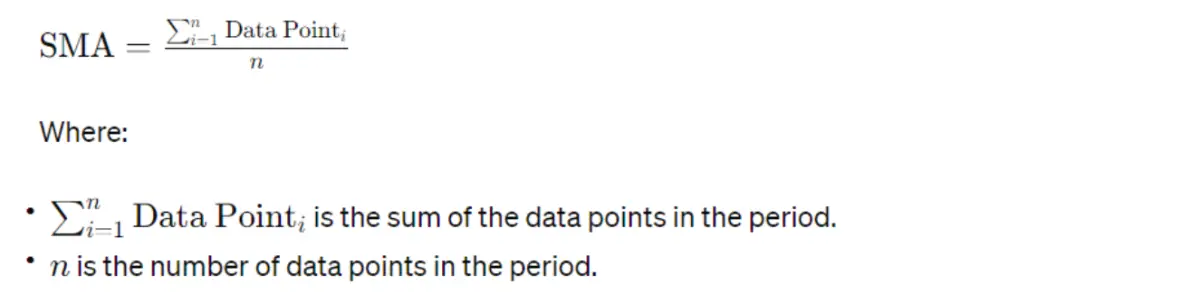
Understanding the SMA Forecast Method
The Simple Moving Average (SMA) is a widely used statistical method to smooth out short-term fluctuations and reveal underlying trends.
By averaging the data over a specific number of past periods, SMA provides a clear view of the direction in which the market or a set of data is moving.
Who Can Use the SMA Forecast Calculator?
This tool is invaluable for:
- Financial Analysts: To predict stock or market trends.
- Economists: For economic data analysis.
- Business Owners: To forecast sales or revenue.
- Students: Learning about statistical methods and data trends.
Where is the SMA Forecast Useful?
The SMA Forecast can be applied in various fields such as:
- Stock Market: For analyzing stock price movements.
- Economics: To understand economic indicators over time.
- Retail: In predicting sales trends.
- Manufacturing: For inventory and production planning.
The simplicity of the SMA makes it an excellent tool for beginners and professionals alike. It's a fundamental component of technical analysis in various industries, offering insights that help make informed decisions.
Benefits of SMA Forecast
- Trend Identification: SMA smoothens the data by averaging out fluctuations. This helps in identifying the underlying trend in a dataset, making it easier to predict the general direction in which a series might move.
- Simplicity: The SMA forecast is easy to calculate and understand, making it accessible to beginners and useful for quick analyses without the need for complex statistical models.
- Baseline Forecasting: It serves as a baseline forecast against which more sophisticated models can be compared. If a complex model does not significantly outperform the SMA forecast, it might not be worth the extra complexity.
- Decision Making: In financial markets, for example, traders might use SMA forecasts to make buy or sell decisions. If the current price is above the SMA, it might be considered a buy signal, whereas if it's below, it might be a sell signal.
Limitations and Considerations
- Lagging Indicator: SMA is inherently a lagging indicator, meaning it is based on past data. The forecast assumes that future values will follow the historical trend, which might not always be true, especially in volatile markets.
- Oversimplification: Relying solely on SMA for forecasting can oversimplify the analysis, ignoring other important factors like seasonal variations, cyclical changes, or sudden market shifts.
- Choosing the Right Period: The effectiveness of an SMA forecast heavily depends on selecting an appropriate period. Too short a period might result in a lot of noise, and too long a period might miss shorter-term trends.
FAQs
Can the Simple Moving Average Forecast Calculator handle real-time data?
The calculator is designed to process historical data efficiently. For real-time forecasting, continuous updates and adjustments based on the latest data are recommended for accurate predictions.
Conclusion
By simplifying the process of calculating the Simple Moving Average, this calculator enables users from various fields, including finance, economics, and business, to gain quick insights into their data patterns.
Whether you're a seasoned analyst or a student starting out, the calculator is designed to help you understand the movement of your data series with ease.
It's an essential addition to your analytical toolkit, providing valuable forecasts that can inform your strategic decisions and planning.