Transitioning to renewable energy sources such as solar, wind, and hydropower can significantly reduce reliance on fossil fuels, thereby lowering carbon emissions associated with energy production.
In today’s fight against global warming, shifting to renewable energy is key in lowering both Scope 1 and Scope 2 emissions. This article explores a range of renewable energy sources: solar, wind, hydroelectric, geothermal, and biomass.
Far from being just substitutes for fossil fuels, these sources are at the vanguard of an energy shift. Adopting these green energy solutions allows both businesses and communities to significantly reduce their direct operational emissions (Scope 1) and the indirect emissions from the energy they purchase (Scope 2).
Our exploration goes beyond just integrating new technologies; it’s about fundamentally changing how we use and generate energy for a more sustainable world.
Renewable Energy Sources
Here are the explanations of renewable energy sources.
Solar Energy
Solar energy harnesses the power of sunlight using photovoltaic cells or solar thermal systems.
Applications in Industries
- Manufacturing: Solar energy can power machinery and processes, reducing reliance on traditional grid electricity.
- Agriculture: Used for water pumping, irrigation systems, and providing electricity for agricultural operations.
- Technology: Used to power data centers and electronic devices, reducing the carbon footprint of the tech industry.
Solar power by country
Worldwide usage of solar energy varies greatly by country, with the top 10 countries representing approximately 74% of the photovoltaic market.
As of 2021, China has the largest solar energy capacity in the world at 306,973 megawatts (MW), which produces roughly 4.8%-6% of the country’s total energy consumption. It is followed by the United States at 95,209 MW and Japan at 74,191 MW.
Top 10 Countries with the Highest Percentage of Solar Energy Penetration (2021 IEA):
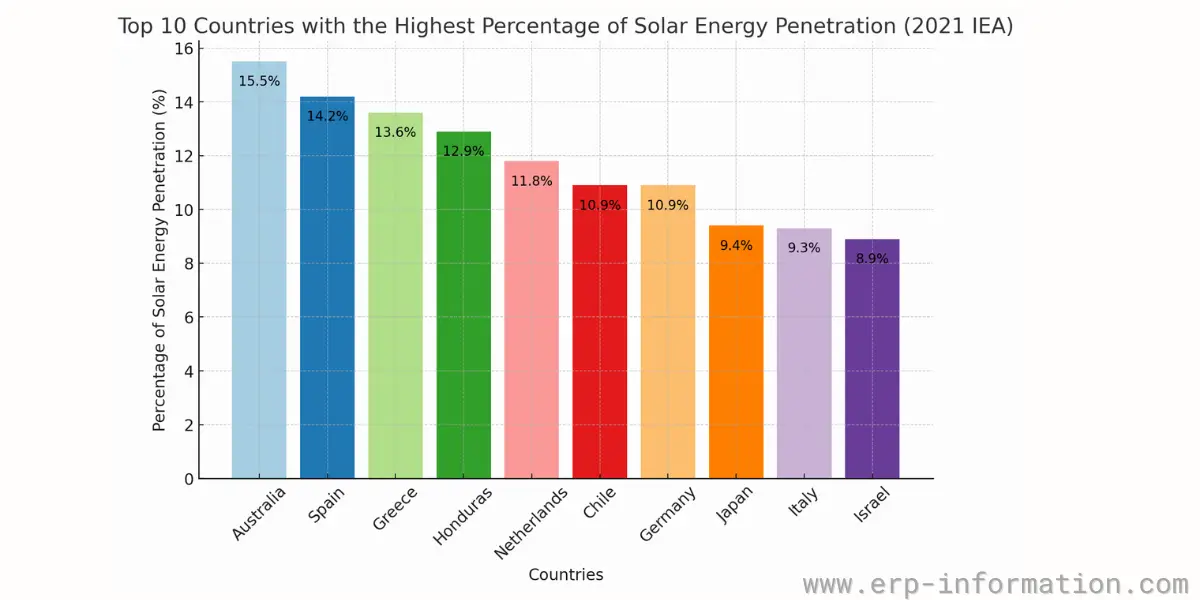
- Australia — 15.5%
- Spain — 14.2%
- Greece — 13.6%
- Honduras — 12.9%
- Netherlands — 11.8%
- Chile — 10.9%
- Germany — 10.9%
- Japan — 9.4
- Italy — 9.3%
- Israel — 8.9%
Wind Energy
Wind turbines convert wind kinetic energy into electricity.
Applications in Industries
- Manufacturing: Used to generate electricity for manufacturing processes.
- Transportation: Powering electric vehicles and sustainable transportation systems.
- Mining: Used to provide energy for mining operations, reducing dependence on fossil fuels.
Amid the global flux in wind investments, Brazil emerges as a beacon of success in the wind energy sector. The country achieved a remarkable milestone in 2022, boasting 25.6 GW of installed wind capacity. This robust performance cements wind energy as one of Brazil’s powerhouse sectors, contributing significantly to the nation’s energy generation portfolio.
In the face of a challenging economic landscape and a disrupted global supply chain exacerbated by health and energy crises, the global wind energy sector demonstrated resilience. In 2022, despite facing the lowest level of wind power capacity additions in the past three years, a notable 78 GW was added, marking the third-highest year in history.
Globally, 77.6 GW of new wind power capacity was integrated into power grids, resulting in a total installed wind capacity of 906 GW—a 9% year-on-year growth. The onshore wind market contributed 68.8 GW globally, with China spearheading a 52% contribution. Despite a 5% decline from the previous year, onshore wind installations faced challenges in Latin America, Africa, and the Middle East, particularly in the United States.
In the U.S., onshore wind capacity additions reached only 8.6 GW in 2022, impacted by supply chain constraints and grid interconnection issues despite a robust final quarter. Europe, on the other hand, showcased resilience and achieved a record 16.7 GW of onshore wind capacity additions, elevating its market share to 24%. North America witnessed a 28% decline in onshore wind additions, while Asia-Pacific maintained consistent figures. Together, these regions constituted 92% of global onshore wind installations in 2022.
Offshore wind, despite a 58% drop in new additions compared to the peak year of 2021, added 8.8 GW to the grid, bringing the total global offshore wind capacity to 64.3 GW by the end of 2022. China, although leading global offshore wind development, experienced a drop in new installations from 21 GW in 2021 to 5 GW in 2022.
Asia-Pacific reported new offshore wind installations in Taiwan (1,175 MW) and Japan (84 MW). Europe contributed the remaining 2.5 GW in 2022, reaching a total offshore wind capacity of 30 GW, with 46% from the UK. With a cumulative installed offshore wind capacity of 34 GW, Asia-Pacific surpassed Europe as the world’s largest offshore wind market in 2022.
Hydropower
Converts the energy of flowing or falling water into electricity.
Applications in Industries
- Manufacturing: Provides a consistent and reliable source of electricity for industrial processes.
- Mining: Powers equipment and machinery in remote mining locations.
- Utilities: Used for large-scale electricity generation in utility-scale hydropower plants.
A mere 22% of the Earth’s surface is fertile, comprising 18% of land and 4% of the ocean. The challenge intensifies as the global population is projected to reach approximately 10 billion by 2050, demanding a 60% increase in food production. Strikingly, while one-third of the global population grapples with overweight issues, 800 million people face a caloric deficit, and 2 billion suffer from micronutrient deficiency.
Biomass Energy
Biomass energy is a renewable energy source derived from organic materials, such as plants, agricultural residues, wood, and animal waste.
Applications in Industries
- Food Processing: Biomass can provide heat for cooking and processing in the food industry.
- Textiles: Used as a source of heat for drying and processing textiles.
- Chemical Manufacturing: Biomass can be converted into biofuels for use in the chemical industry.
It involves harnessing the stored chemical energy in these materials and converting it into useful forms, typically heat or electricity.
Geothermal Energy
This energy originates from the Earth’s internal heat, primarily driven by the radioactive decay of minerals and the residual heat from the planet’s formation.
Applications in Industries
- Greenhouses: Used for heating and cooling in agricultural greenhouses.
- Manufacturing: Provides a constant source of heat for industrial processes.
- Aquaculture: Geothermal energy can be used for temperature control in fish farms.
According to the World Geothermal Congress 2020 (WGC2020), the number of countries directly utilizing geothermal energy has increased to 108. This was a substantial rise from 2015 and previous years, showcasing a growing global interest in harnessing geothermal resources for various applications.
The approximate installed energy generation rate for direct usage at the end of 2019 was reported to be 107,727 megawatts thermal, indicating a 52.0% increase over the data from 2015 and a compound annual growth rate of 8.73%.
Moreover, thermal energy consumption experienced a remarkable 72.3% increase over 2015, reaching 1,020,887 terajoules per year and expanding at a compound annual rate of 11.5%.
This data underscores the escalating significance of geothermal energy on a global scale, with more nations recognizing and actively harnessing its potential for sustainable power generation.
Let’s break down the key information provided and perform some calculations based on the data:
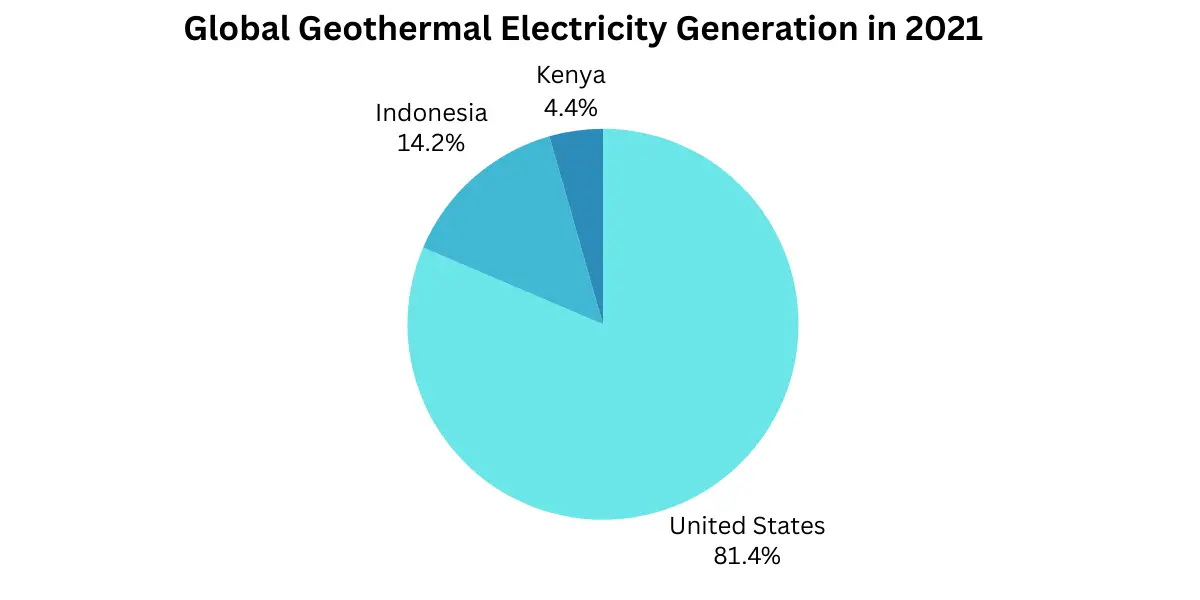
Global Geothermal Electricity Generation in 2021
- United States: 92 billion kWh
- Indonesia: 16 billion kWh
- Kenya: 5 billion kWh
Percentage Share of Geothermal in National Electricity Generation
- In Indonesia: 16 billion kWh is 5% of the total electricity generation.
- In Kenya: 5 billion kWh is 43% of the total electricity generation.
U.S. Geothermal Electricity Generation in 2022
- United States: 17 billion kWh (or 17,002,000 megawatt-hours)
Percentage of U.S. Geothermal Electricity in Total U.S. Utility-Scale Generation
- Geothermal generation in the U.S. is about 0.4% of total U.S. utility-scale electricity generation.
Indonesia
Percentage of Geothermal in Indonesia’s total electricity generation = (16 billion kWh / Total Indonesia’s electricity generation) * 100
Kenya
Percentage of Geothermal in Kenya’s total electricity generation = (5 billion kWh / Total Kenya’s electricity generation) * 100
United States
Percentage of Geothermal in U.S. utility-scale electricity generation = (17 billion kWh / Total U.S. utility-scale electricity generation) * 100
Tidal and Wave Energy
Tidal energy is a renewable energy source that harnesses the gravitational forces between the Earth, the moon, and the sun to generate electricity. This energy is derived from the rise and fall of ocean tides, and there are two primary methods for capturing tidal energy.
Tidal Stream
Systems
- Tidal stream systems, also known as tidal current systems, utilize underwater turbines placed in areas with strong tidal currents.
- As tides flow in and out, the kinetic energy of moving water rotates the turbines, converting mechanical energy into electricity.
- The efficiency of energy conversion depends on the speed and direction of tidal currents.
Tidal Range
Systems
- Tidal range systems exploit the difference in height between high and low tides.
- Tidal barrages, large dams built across estuaries or tidal basins, feature sluice gates that control the flow of water during tide changes.
- The movement of water through turbines during these tide changes generates electricity.
Wave Energy
Wave energy is harnessed from the up-and-down movement of water caused by the wind. Waves carry a significant amount of energy, and capturing this energy involves using devices that move with the waves, such as floating structures or oscillating water columns.
Point Absorbers and Oscillating Water Columns
Point absorbers are buoyant structures that move up and down with the motion of the waves. This vertical movement drives a generator, converting the mechanical energy into electricity.
Attenuators and Oscillating Body Converters
Attenuators are long, multi-part structures that move with the waves, and the relative motion between the segments generates electricity.
- Applications in Industries
- Coastal Industries: Provides a continuous and predictable source of electricity for industries located near coastlines.
- Desalination: Tidal and wave energy can be used to power desalination plants for freshwater production.
- Shipping: Renewable energy can be used to power electric ships, reducing reliance on traditional fuels.
Conclusion
Renewable energy sources offer diverse applications across industries, contributing to sustainability goals and reducing the environmental impact of various sectors.