Standard deviation (SD) is a powerful statistical tool that goes beyond mere numbers and reveals the fascinating world of data variability.
At its core, standard deviation enables you to measure how individual data points deviate from the average or mean value. By calculating SD, you gain insights into the spread or dispersion within a dataset.
This tool helps one to confidently navigate the complexities of variability analysis, whether you are an investor, researcher, or decision-maker.
This article will explore the concept of standard deviation, including the formula for calculating it, the calculation with an example, its strengths, limitations, and the difference between variance and standard deviation.
Evaluate standard deviation using the Standard deviation calculator online
What is the standard deviation?
It is a statistical measure of spreading your data. It tells you how different your data is from the average or mean value. It can measure investment risk and compare different data sets.
SD is a useful tool for investors
- It allows them to measure the riskiness of an asset, providing insight into how much volatility they can expect.
- High standard deviations indicate that an investment carries higher risks with potentially high rewards than more stable investments, which come with greater certainty and consistency but less reward potential.
- Although you cannot always depend on standard deviation alone when assessing financial decisions, it provides valuable insights into what outcomes may arise from your choices.
What is the standard deviation formula?
The below formula is used to find the SD:
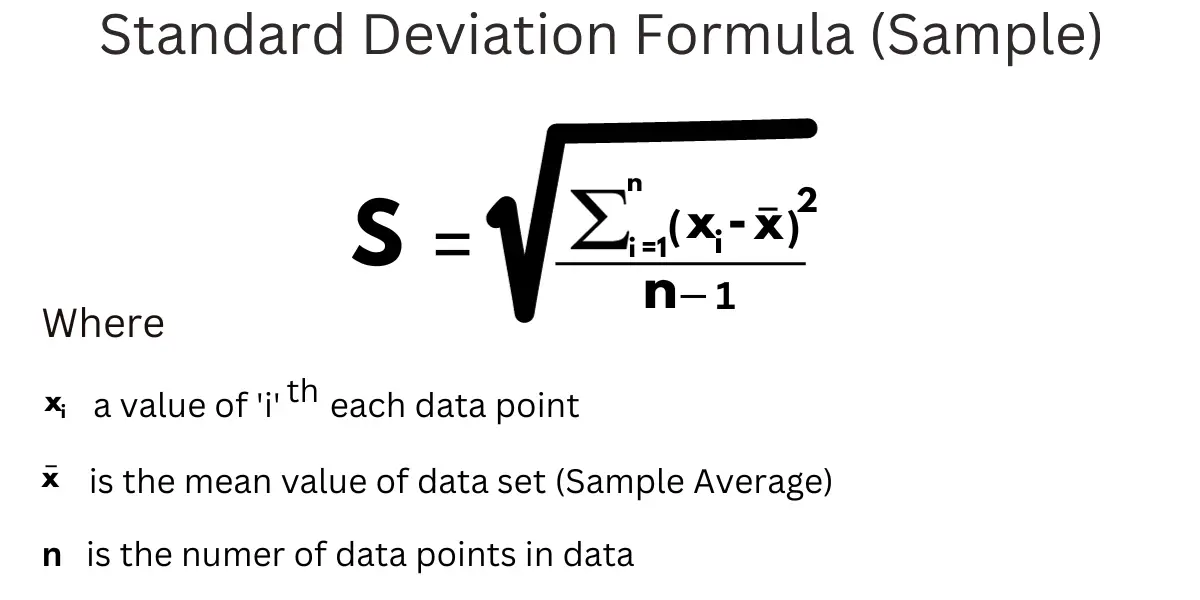
The above formula is used to calculate the SD of the population sample.
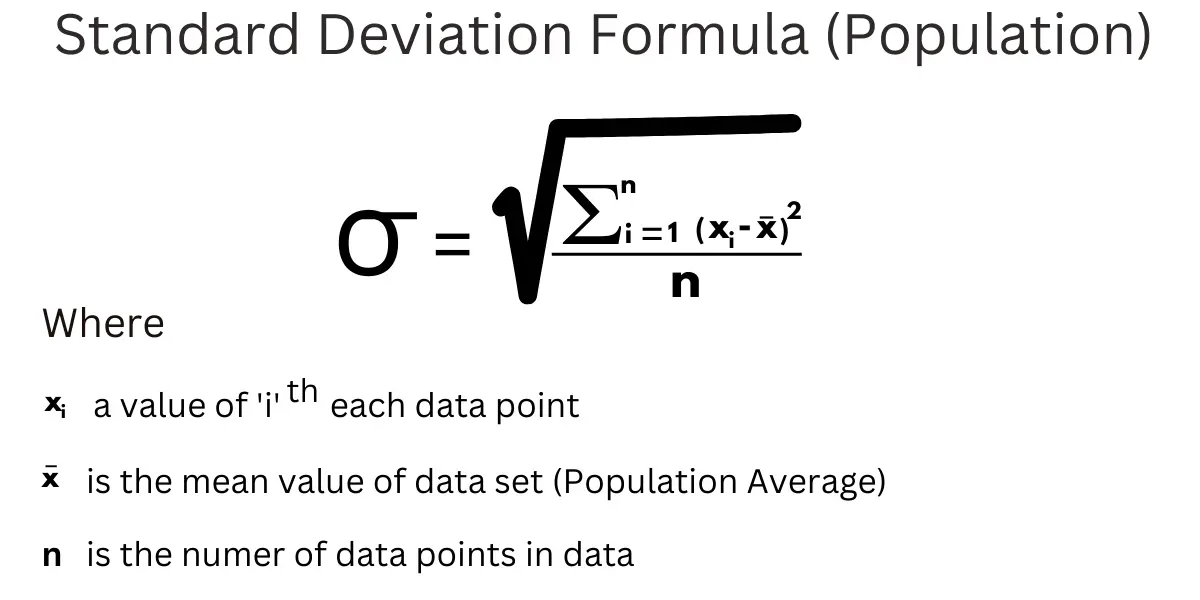
This formula is used to calculate the SD of the entire population.
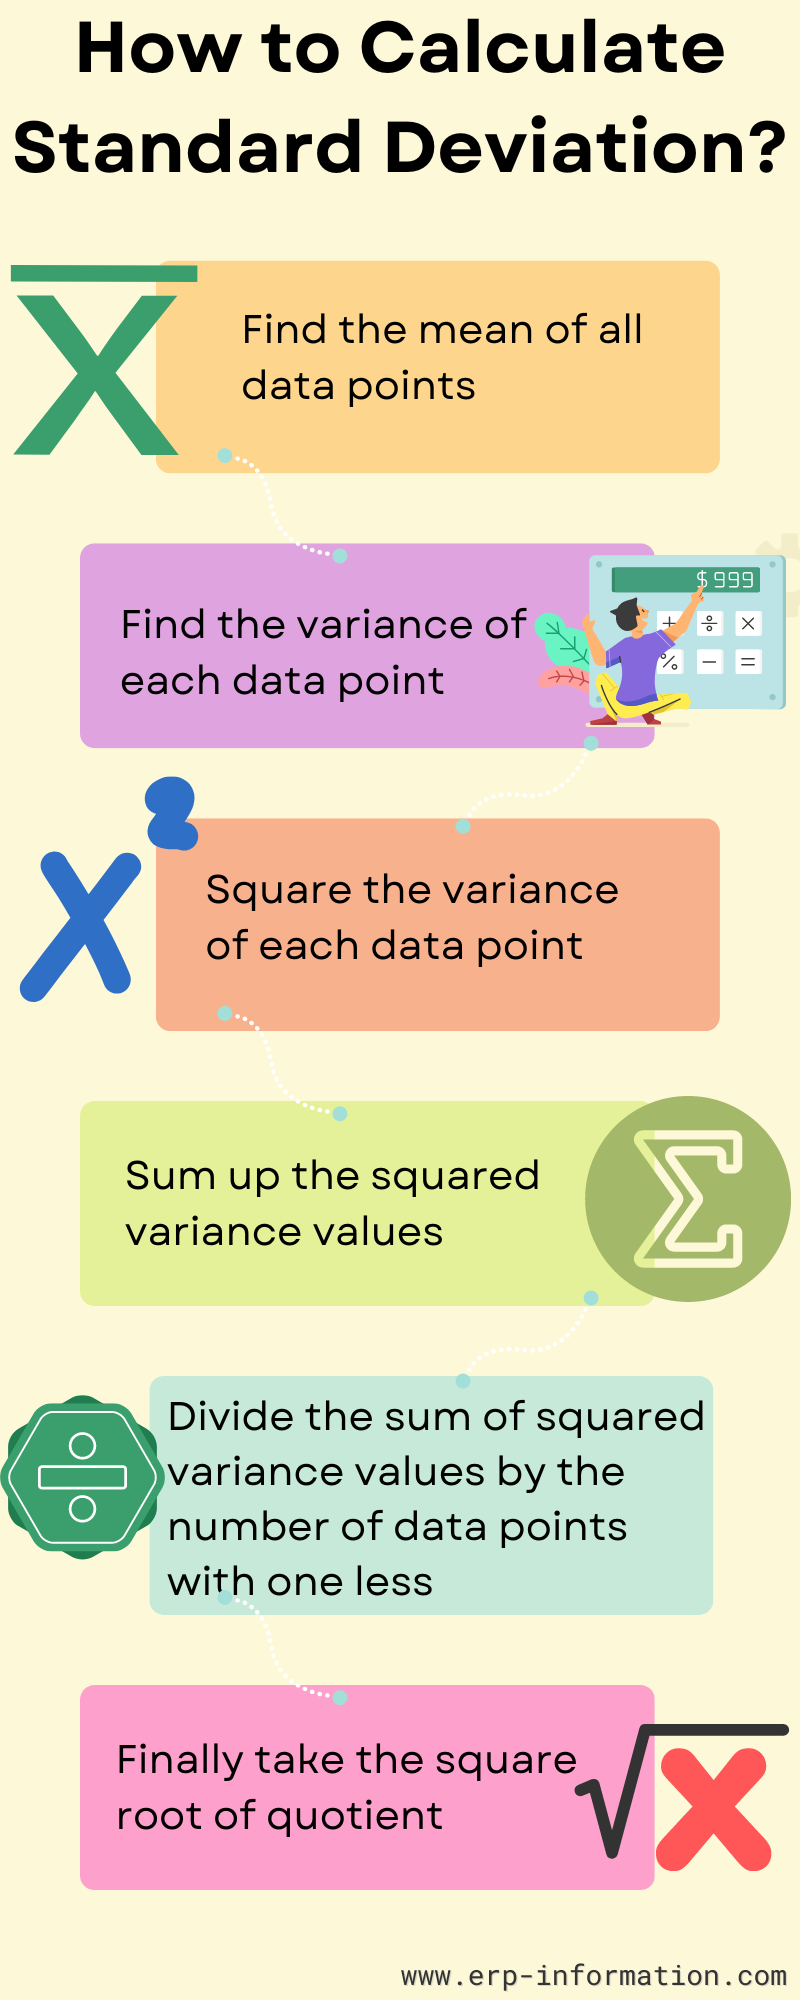
How do we calculate standard deviation?
- To find the mean of a data set, add all its values and divide by the number of points.
- Calculating variance for each point is determined by subtracting that particular value from the mean.
- Squaring this variance gives us an indication of how much it deviated from the average.
- The sum squared variances are then divided by one less than.
- Total points to get our final answer–the square root of which reveals how diverse the entire dataset truly is!
Calculation example
In industries and businesses, standard deviation is utilized for budgeting and expenditure tracking purposes. By calculating the SD of historical expenses, businesses can assess the variability around the average expenditure.
This information helps in setting realistic budgets that account for potential fluctuations. SD is also used for risk analysis, identifying areas with high expenditure variability, and implementing cost control measures.
It enables businesses to evaluate performance consistency, make accurate financial forecasts, and plan for contingencies. Standard deviation is valuable for businesses to manage budgets, assess expenditure variations, and make informed financial decisions.
To demonstrate the practical application of standard deviation in budgeting, we present a simple example involving analyzing a person’s weekly expenses for eating out.
By examining their spending patterns, we can determine how they can effectively manage and potentially save on their expenditures. Calculating standard deviation is possible using a spreadsheet, a calculator, or different applications.
The table below shows the money spent over the week on eating out. Money spent is a data point (Xi).
| Days | Money spent in Dollars($) (Xi) |
| Monday | 10 |
| Tuesday | 5 |
| Wednesday | 20 |
| Thursday | 15 |
| Friday | 20 |
Step 1: Calculate the average (mean) of daily expenses.
That is, (10 + 5 + 20 + 15 + 20) / 5
= 70/5
= $14
Step 2: Calculate the deviation for each day by subtracting the average from the corresponding daily expense. Then, square each deviation obtained. Check the table for the calculation.
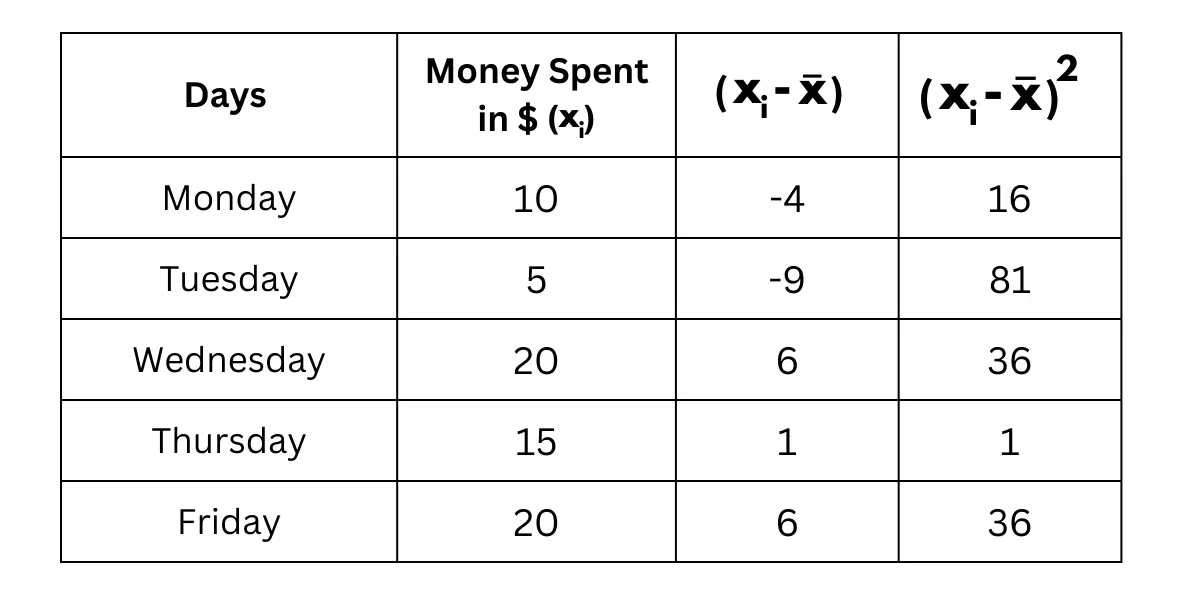
Step 3: Calculate the average of the squared deviations.
That is 16+81+36+1+36 / 5
= $34
Step 4: Take the square root of the average of squared deviations. This gives you the standard deviation. Value = $5.8.
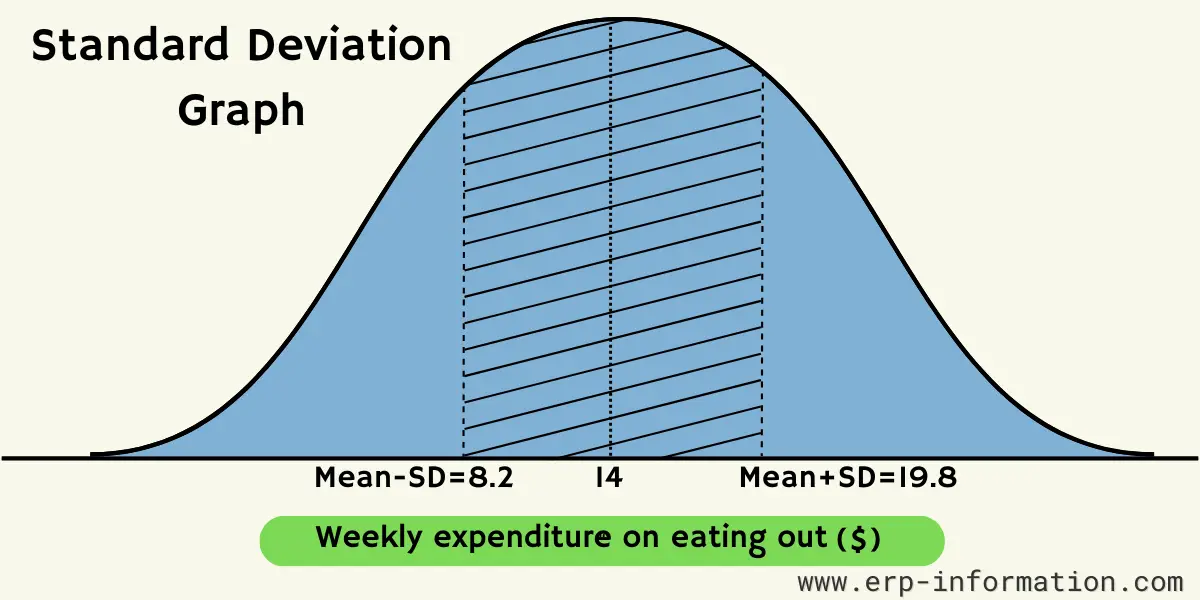
Here the Mean = $14 and SD=$5.8
The graph below is a typical standard deviation graph that can help analyze the mean and the variance of the person’s weekly expenses.
In larger enterprises like manufacturing, where there is greater variation in expenditure amounts and time durations, standard deviation becomes crucial in gaining deeper insights into the population or sample dataset.
It helps analyze how closely individual values align with the average and helps one determine expenses of various kinds.
Standard deviation is utilized in the financial realm to monitor stocks and shares and finds application in various other aspects.
It helps track and assess the volatility and variability of different financial instruments and market indicators, enabling investors and analysts to make informed decisions.
How do we use standard deviation in different situations?
It can be used in a variety of ways. For example,
- It can help you compare different sets of data and look for patterns.
- This will be used to measure the risk associated with an investment, as a higher standard deviation indicates that the range of possible outcomes is greater.
- Additionally, it can be used to detect outliers in a set of data.
- These investments could yield generous returns, with portfolio managers betting aggressively and taking risks.
- Measuring risk is an integral responsibility for investment firms, and one of the key methods they use to do so is the standard deviation. This metric provides insight into how much a mutual fund or other product fluctuates in value over time – allowing financial analysts, managers, and advisors to make informed investment decisions.
Tips for effective use of SD
- Ensuring that your data set is as accurate and complete as possible is important when calculating standard deviation.
- Additionally, looking at the range of values rather than just the mean value can be helpful, as this will give you a greater understanding of how spread out the data is.
Standard deviation calculator
Many online calculators available can help you quickly and accurately calculate the SD. These calculators are easy to use and will provide the information you need in seconds.
What does variance mean?
Variance is a way to measure the spread between numbers in any given data set. It’s determined by taking each number, subtracting it from the mean, and squaring that difference – giving us an idea of how much each point differs from all other entries across our entire spectrum.
By understanding variance, we can gain powerful insights into complex sets of information.
Difference between standard deviation and variance
| Standard deviation | Variance |
| It can be calculated by discovering the square root of the variance. | It is the average difference from the mean. |
| It shows the spread between numbers in the dataset. | The data reveals the contrast between each point and the mean, giving us an insight into how far from average any given situation is. |
| It will be expressed the same as a unit in the data set. | It will be expressed in squared units or percentages. |
Strengths
- The majority of analytics use the standard deviation from investing to actuaries.
- This is a more accurate, robust statistical measurement.
- The standard deviation of 2 data sets can be merged using a specific formula.
- This is the only powerful formula to measure dispersion observation.
Limitations
- It does not measure how far the data point is from the mean.
- This can be used for algebraic calculations but is not different from the actual dispersion from the mean.
- There is a heavier impact of outliers on the SD
- Manual calculation of SD is very difficult
FAQs
What does a high deviation mean?
The data observed can be characterized as either widely varied or closely knit groupings based on the size of their standard deviation. If it is high, there is a great deal of dispersion in the observations; if low, most appear to huddle around an average.
What do variance and standard deviation tell?
Variance and SD are powerful indicators of the dispersion of data values from their average. By analyzing them, we can examine how far these numbers strayed from what is normal for that set.
What are the domains in which standard deviation is used?
Generally, SD is useful for understanding and analyzing data. It can be used in a variety of fields to make better decisions.
Manufacturing: A manufacturer might use standard deviation to ensure the consistency of the quality of their products.
For example, a car parts manufacturer might use SD to measure the variability in the thickness of a metal sheet.
If the SD is too high, then the manufacturer knows that the thickness of the metal is not consistent.
Finance: An investor or financial experts might use SD to choose between two investments.
Assume that an investor is investing in two different stocks. They might compare the standard deviation of the returns of the two stocks.
If one stock has a higher SD, then the investor knows that the returns of that stock are more volatile. That could mean that the stock is riskier but has the potential for higher returns.
Medicine: A clinical trial might use SD to measure the effectiveness of a new drug.
For example, a clinical trial for a new flu drug might measure the variability in the number of patients who get the flu after taking the medicine.
If the standard deviation is low, the researchers know the drug effectively prevents the infection.
Sports: A team, such as in cricket, could also use standard deviation to measure the consistency of other player metrics, such as bowling average, fielding percentage, or strike rate.
By measuring the standard deviation of a player’s performance, teams can identify players more likely to be inconsistent.
Climate and Weather studies: Used to measure the variability of climate and weather variables, which can be used to identify trends, assess risk, and make predictions.
Conclusion
In conclusion, the standard deviation emerges as a vital tool for quantifying variation and assessing risk within data sets and investments.
Armed with an understanding of the formula, calculation, and its applications in diverse scenarios, you gain the ability to make informed decisions, optimize strategies, and unlock the true potential for success.
This article discussed the basics of SD and its uses. We also discussed the formula for calculating it and how to use it effectively.
Finally, we discussed why having an accurate SD calculator is important. With this knowledge, you can better understand the data you are working with and make more informed decisions.