In Bell Laboratories, USA, the concept of Statistical Process Control took birth in 1924. Dr. Walter Shewhart, who worked there, first designed the control chart and proposed statistical control.
This quality control process was significantly used to monitor product quality and safety for defense weaponry during World War II. Dr. W. Edwards Deming successfully adopted Statistical Process Control (SPC) into the Japanese industry post-war.
Today many industries and firms apply SPC as a basic measure to improve product quality and control process variation.
This blog post will discuss statistical process control, its applications, working, tools, advantages, and disadvantages.
Definition of statistical process control
It implements statistical methods to monitor and control manufacturing processes. It is also referred to as statistical quality control and effectively improves the process.
The data is acquired throughout the manufacturing process through readings or measurements from the machinery or apparatus used and is later used for evaluation.
Applications
This is suitable for any process-related industry with repetitive operations. Any industry that wants to take over the market has to concentrate on enhancing the efficiency and quality of its products and, at the same time, aim to be cost-effective.
SPC plays a major role; it helps an industry or organization monitor the process constantly, and any change in the operations as and when detected is prevented so that it does not in any way impact the performance.
It has been applied to many setups, such as healthcare-related processes, manufacturing industries, administration, financial auditing and accounting, billing, etc.
Recently, it has been used for data warehousing, data quality management, and IT operations.
Implementation of SPC takes place in 3 distinct steps
- Conceptualizing the process and the specification limits
- Removal of any sources of variation
- Monitor the production process in progress with the help of tools
How does SPC work?
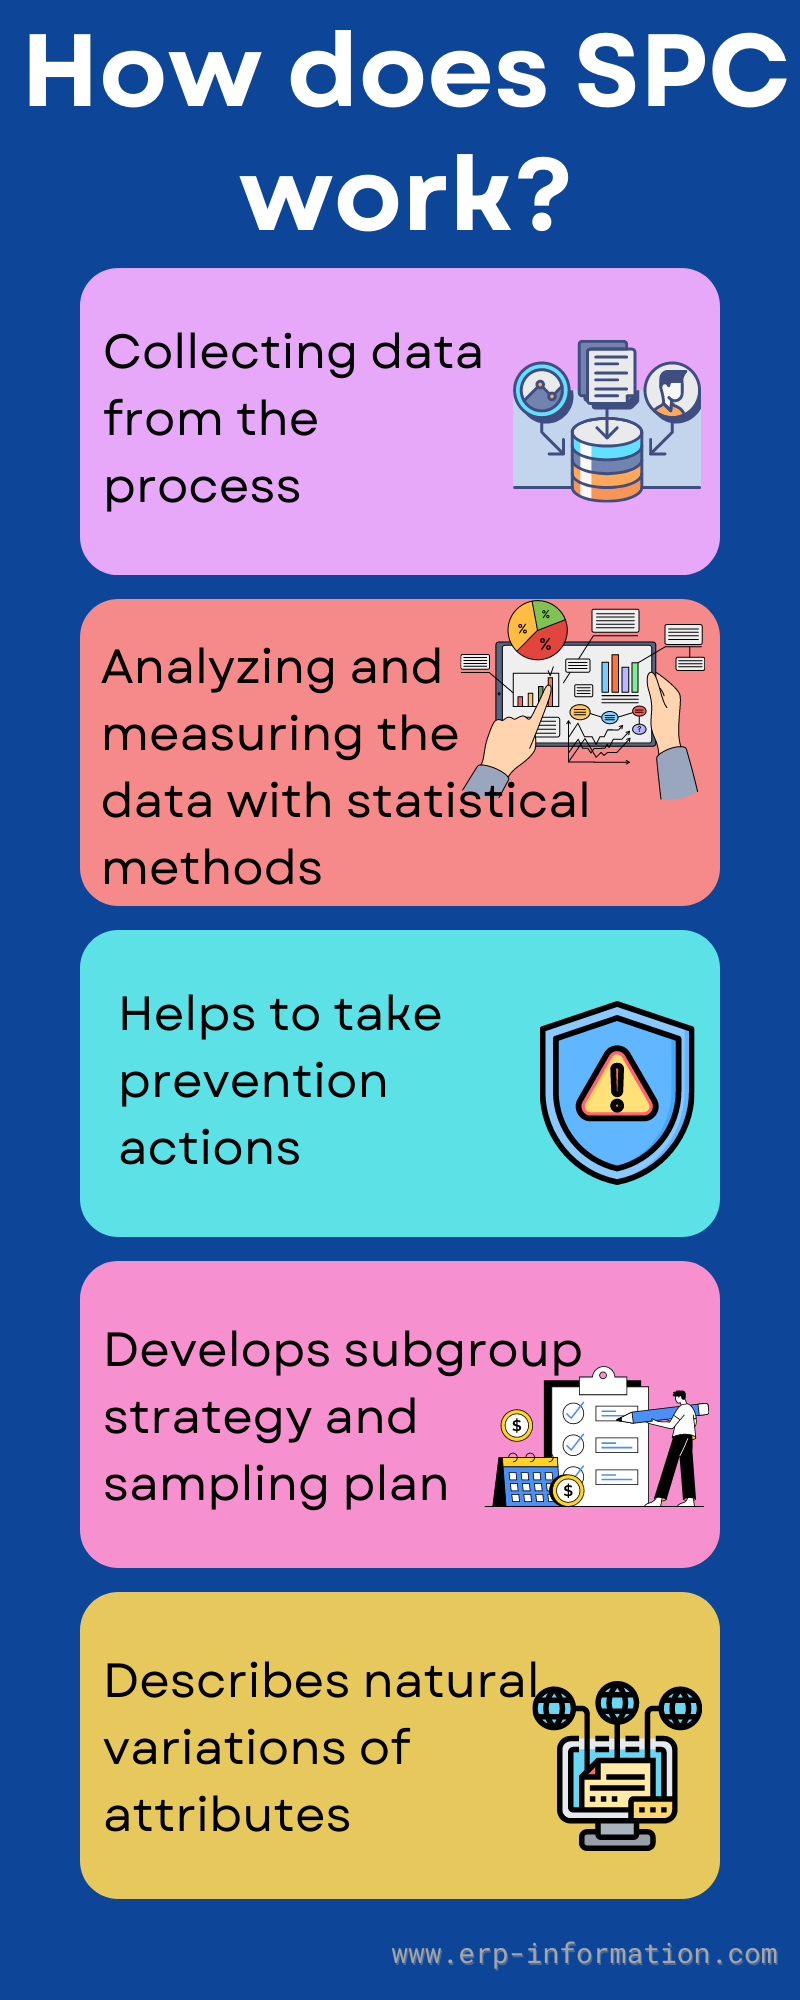
Collecting data from the process
It is a powerful tool for businesses to analyze their processes. Inherent to SPC’s ability to measure significant output metrics of a product or process, companies can quickly identify processes that may impact the final product.
Furthermore, this same data can help uncover potential issues regarding customer needs, allowing businesses to create efficient processes tailored exactly to their customer’s desires.
It provides a powerful analysis of valuable information that can save businesses time and money by providing critical insights into their operations.
Analyzing and measuring the data with statistical methods
This tool has the power to reveal the true attributes that need measuring in the production process.
It uses sophisticated statistical methods, such as Statistical Quality Control (SQC), to define variables and determine which factors affect product quality.
This allows for more reliable inspection and pinpoints problems that are only sometimes further enhanced via visual checks. It also helps us distill relevant information from large datasets to understand product trends over time better.
Helps to take preventive actions
By monitoring the output of a process, SPC enables organizations to catch quality problems early and prevent them from occurring in the future. This preventive action allows organizations to maintain consistent quality standards and take corrective action when necessary.
In addition, by embracing an SPC system, organizations can increase employee engagement, identify improvement opportunities, reduce variation in production processes, and deliver higher quality products to market more efficiently.
Develops a subgroup strategy and sampling plan
This tool is good for predicting the future of production processes. It not only helps you determine the subgroup size based on a product’s criticality, but it can also help determine the sampling size and frequency.
It can provide accurate predictions that enable companies to forecast changes and anticipate potential challenges to remain competitive in their industries.
Describes natural variations of attributes
It involves calculating and setting appropriate control limits using predefined formulas that indicate an acceptable range of values for the given attribute. Doing this can determine if processes are in or out of statistical control.
Control limits within normal values enable teams to make informed decisions about experimentation or adjusting existing methods. With Statistical Process Control, it is possible to recognize natural variation so that teams can take advantage of it instead of fighting against it.
Tools
SPC consists of tools and methods that can measure and examine the process data to characterize the process and gain control. Statistical process control uses seven quality control tools and seven supplement tools.
Quality control tools
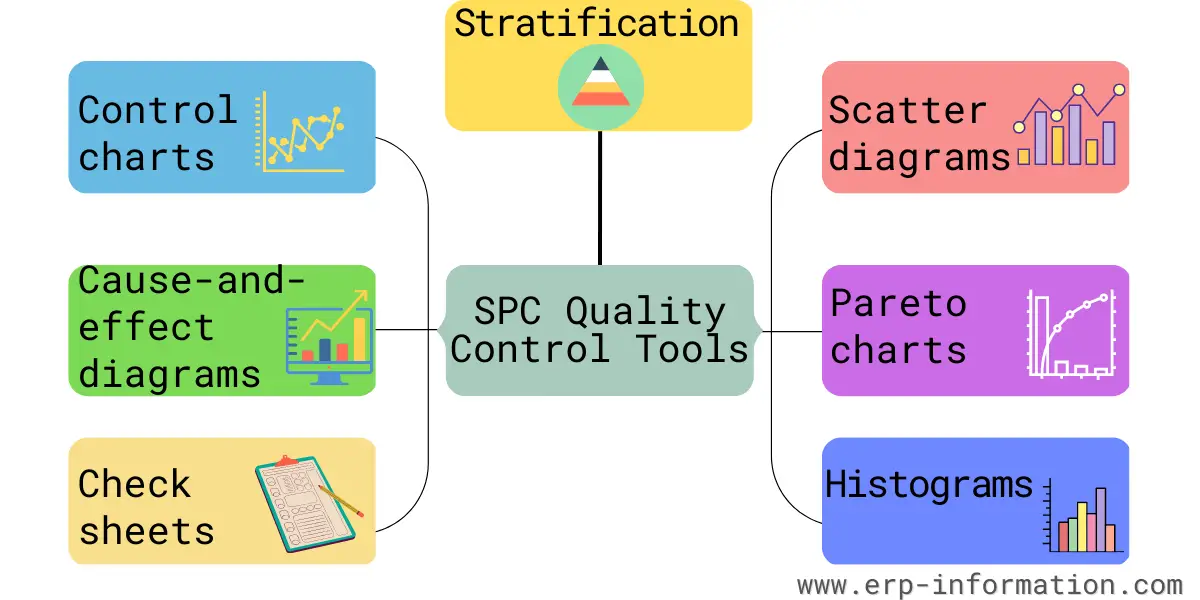
1. Control charts
Classical and most accepted statistical process tools. The X-bar and R chart is a way to track data. The X-bar chart shows the average value of the variable x. The Range chart shows the variation within the subgroup.
2. Cause-and-effect diagrams
These are also known as the fishbone diagram. When generated, they resemble a fishbone and are used to detect the many causes of any problem.
3. Check sheets
These are readily available forms for analyzing data under observation. These are continually generated and collected at a single location by the same person.
4. Histograms
Histograms are similar to bar charts and are preferred for numerical data. Therefore, they are represented as frequency distribution graphs.
5. Pareto charts
These bar graphs represent the Pareto 80/20 principle, where 20% of the processes are set to rectify 80% of the problems. They are graphs either to indicate the Time vs. Money or Frequency Vs. Cost is mainly used to estimate the problem frequency.
6. Scatter diagrams
These X_Y graphs are well-suited when put together with numerical data.
7. Stratification
This tool segregates data that explicates pattern recognition and is ideal for data from various sources. Stratification is a process that categorizes entities, persons, and related data into layers or specific groups.
Supplemental tools
1. Data stratification
This tool separates data into smaller and more predefined segments according to a set of standards.
2. Defect maps
These maps are used for detecting and visualizing the defects and their location within the products.
3. Events logs
These logs are standardized records that record the key software and hardware events.
4. Process flowcharts
Process flowcharts are image shots of process sequences displayed in the order of occurrence.
5. Progress centers
These are progress centers that allow organizations to monitor progress and data collection.
6. Randomization
This tool assigns manufacturing units to a treatment group.
7. Sample size determination
This tool estimates the number of events or persons counted in a statistical analysis.
Advantages
- Decreased wastage and warranty costs
- Increase in productiveness in a manufacturing line
- Operational efficiency is enhanced
- The need for manual inspections is less
- Customer satisfaction improved
- Prices are at the check
- Analytics and reporting are upgraded
Disadvantages
- Implementing and manufacturing process may take time
- Monitoring the process and filling out the chart is a bit difficult and time-consuming
- Need investment in training and materials so that it may be expensive
- It is not capable of identifying the number of defective products to a certain point
FAQs
Which tools are commonly used in Statistical Process Control?
List and briefly describe tools like control charts, histograms, and Pareto charts commonly used in SPC.
Why is Statistical Process Control important in manufacturing?
Explain the significance of SPC in ensuring consistent quality and efficiency in manufacturing processes.
Conclusion
Statistical Process Control is an essential tool for any organization that wishes to operate efficiently and effectively.
By providing organizations with the ability to monitor and control processes, SPC can help identify and eliminate waste, maintain product quality standards, reduce costs, and improve customer satisfaction.
In addition, through accurate data collection and statistical analysis, SPC provides organizations with the means to achieve their goals.