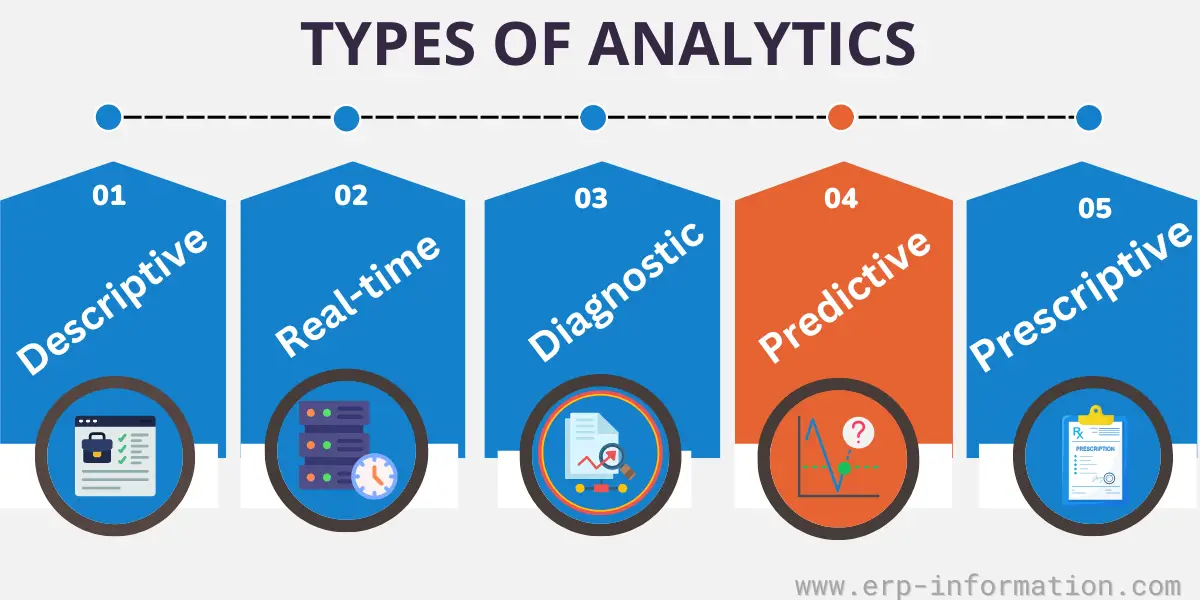
Businesses use different types of analytics to work well. Predictive analytics is one of them. Others are descriptive, real-time, diagnostic, and prescriptive analytics. Each type has its benefits, which help businesses be successful.
It has the potential to revolutionize how businesses and organizations approach decision-making. It uses big data and powerful tools to forecast what will happen in the future.
Companies use it to have an advantage over their competitors today. Predictive analytics is proving itself as a valuable asset in many industries.
This blog post will spotlight what predictive analytics is, how it works, its techniques, use cases in different industries, and advantages and disadvantages.
What is predictive analytics?
Predictive analytics is an important tool for businesses seeking to make data-driven decisions and gain a competitive edge. It uses statistical algorithms and machine learning (ML) techniques to look at old data and figure out what could happen in the future.
Predictive analytics can forecast customer behavior, identify potential risks and opportunities, optimize marketing campaigns, and improve operational efficiency.
In today’s business world, there is a lot of data and many companies competing against each other. Predictive analytics is an important tool for companies who want to stay in the lead. It helps them make smart decisions about the future.
Predictive models use past data and information to determine a business’s risks and chances. These models look at many different things to decide whether a certain transaction is a good idea. This helps with making decisions.
Predictive analytics techniques
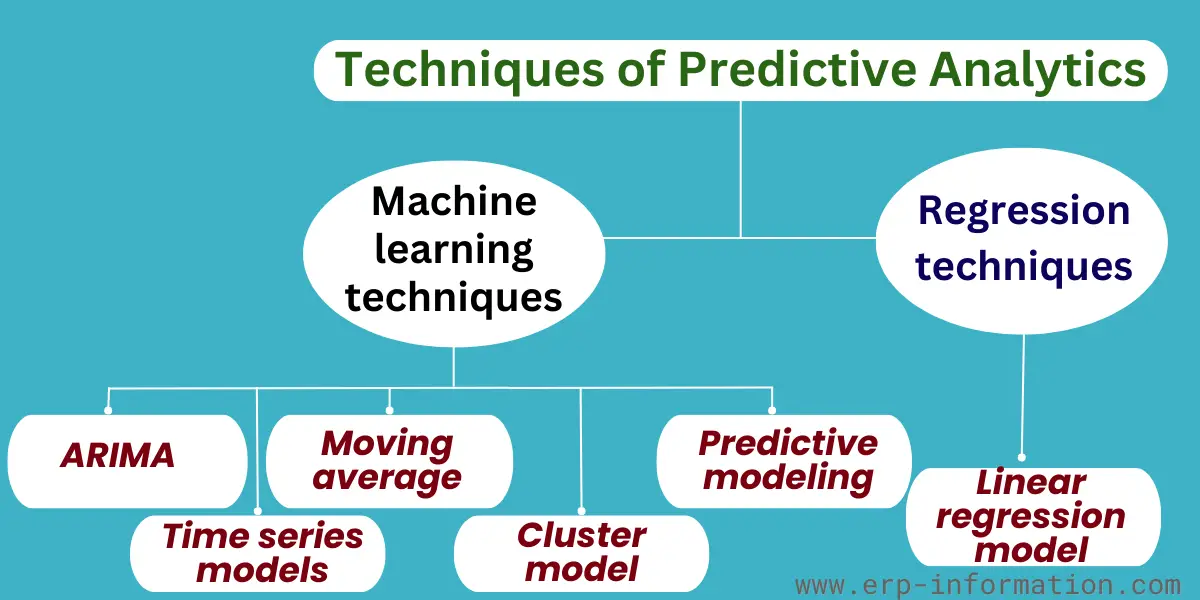
Machine learning techniques
Machine learning is the most important technique of predictive analysis. ML means when a machine can do things that people do. It uses artificial intelligence, algorithms, and models to act like a person. This includes the following models.
Time series models
Time series models are a type of machine learning. They use data from the past to understand and predict things in the future. This data is called “time series,” which means a sequence of numbers over certain periods, like years or months.
Autoregressive integrated moving average
ARIMA models study how something changes over time. Autoregression is used in these models, which means that a machine can be used to do calculations and make predictions about the future.
Moving average
Single-moving average methods use smaller groups of past data to reduce the number of mistakes that come from taking only one average. That makes it more accurate than using the average of all the data.
Centered moving average methods use the data from single moving average methods. To calculate this method, you take an average of the middle set of numbers. It works better with groups of odd numbers because it is harder to do with even numbers.
Cluster model
Clustering is when you group data that have similar things. This helps to find out if there are other traits they share. This can help figure out what could happen in the future.
Predictive modeling
It is a way to guess what will happen in the future. It looks for patterns from past data and uses those patterns to make predictions. Predictive models are like data mining and use old and new information to guess what could happen next.
Regression techniques
Regression analysis uses data and information from the past to make guesses about what will happen in the future. It looks at how certain things are related, like how one thing can affect another.
Linear regression
In linear regression, you need to put the values of one variable on the Y-axis (the dependent variable) and the values of another variable on the X-axis (the independent variable).
You can then use a statistical program to draw a line between these variables. This line helps predict what will happen with the dependent variable based only on the values of the independent variable.
The regression line has an equation that includes a number for the error term. A high value for the error term means that the regression model isn’t very accurate. Other variables can be added to the model and analyzed to make it more accurate.
Regression and classification algorithms are the most common ways to guess values, find similarities, and spot unusual patterns in data.
Process of predictive analytics
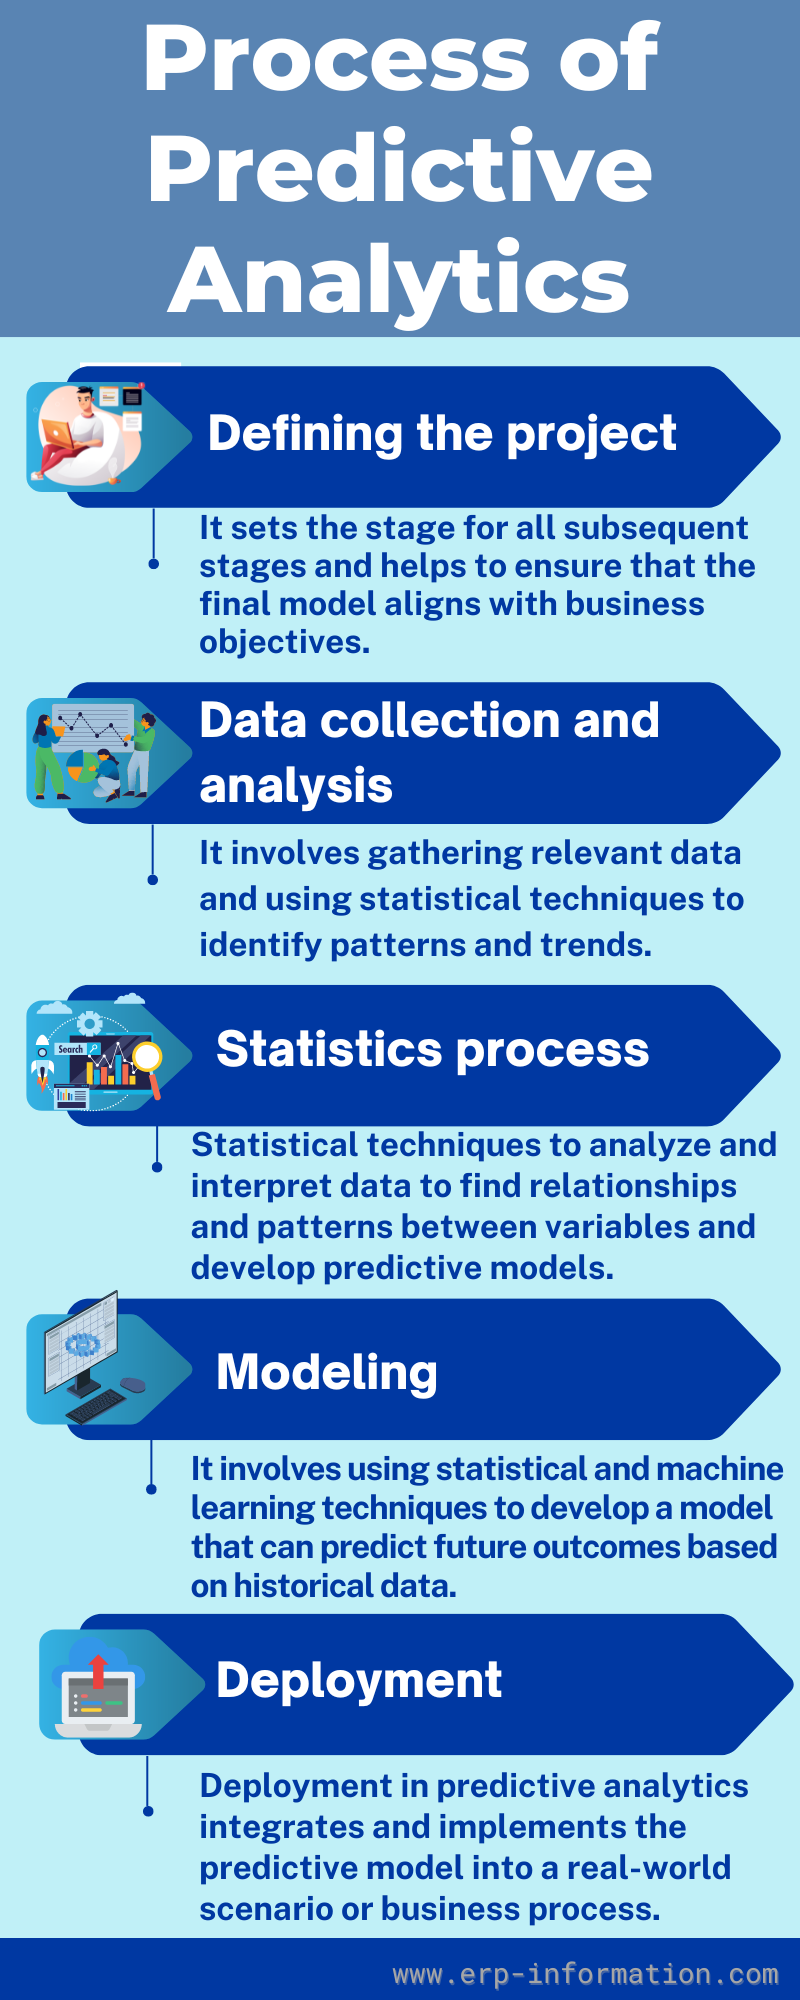
Defining the project
Defining a project in predictive analytics involves clearly defining the business problem or question the predictive model will address.
This is a critical stage in the predictive analytics process, as it sets the stage for all subsequent stages and helps to ensure that the final model aligns with business objectives.
Data collection and analysis
This process in predictive analytics involves gathering relevant data and using statistical techniques to identify patterns and trends. It ensures that the data used for the predictive model is accurate, relevant, and reliable.
Statistics process
The statistics process in predictive analytics involves using statistical techniques to analyze and interpret data to find relationships and patterns between variables and develop predictive models.
It helps businesses can gain valuable insights into their operations. As a result, businesses can make data-driven decisions and drive growth and success.
Modeling
The modeling process in predictive analytics involves using statistical and machine learning techniques to develop a model that can predict future outcomes based on historical data.
Deployment
Deployment in predictive analytics integrates and implements the predictive model into a real-world scenario or business process.
This step involves using the predictive model by making data-driven decisions and taking action based on the model’s recommendations.
Use cases of predictive analytics in different industries
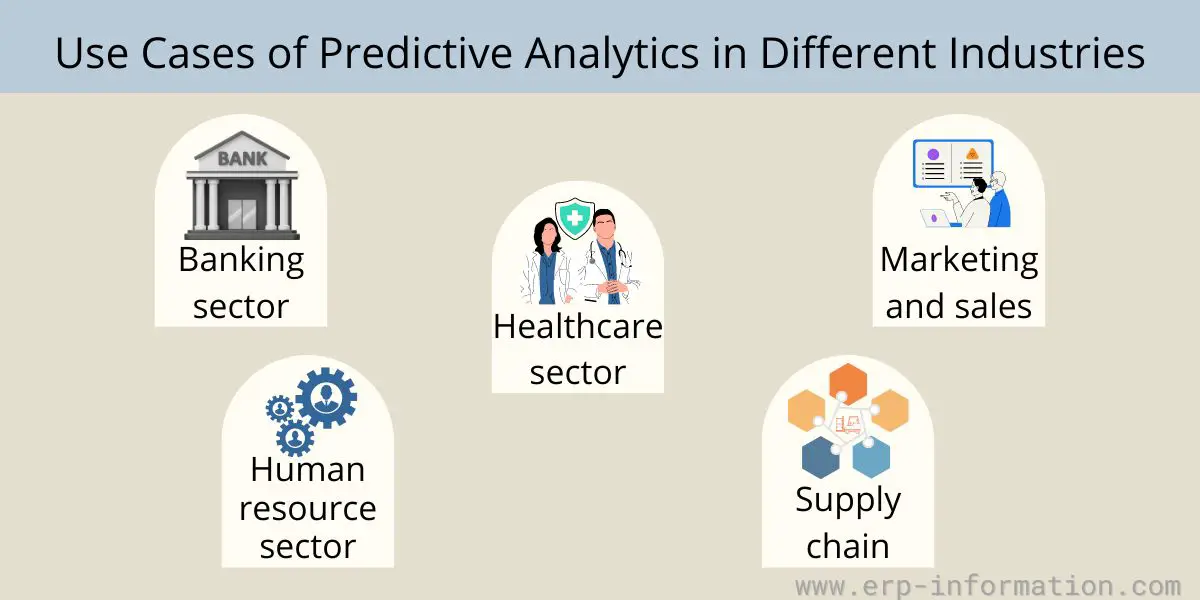
Banking sector
Financial services use technology like machine learning and quantitative tools to make sure people will pay back loans and find people who are cheating.
This technology also helps them give people the best service they can. It helps them customize things for each person and ensures no one is taking too much risk.
Human resource sector
HR teams use data and surveys to determine which job applicants are best for the job and help people keep their jobs.
Healthcare sector
Predictive analytics are useful for taking care of the health issues of chronically ill patients. Geisinger Health System (GHS) uses predictive analytics to look at health records and learn more about how chronic infection is diagnosed and treated.
Supply chain
Businesses use predictive analytics to manage their products and set good prices. It helps them know how much stock they should keep in the warehouse. And also useful for them to predict how much money they will make from their products.
Marketing and sales
Marketing and sales teams use business intelligence reports to look at how well they sold in the past. It helps companies be more prepared when they talk to customers and help them with their needs.
Advantages
- It helps to compete with other companies in the market.
- It helps to detect fraud and smoother the process and performance.
- Improves work collaboration.
- Helpful in the complete utilization of assets.
- The analysis is useful for quality and quantity production.
- Helpful for the identification and reduction of risk.
- Techniques may help increase sales, predict how much money the company will make, ensure products are made well, and even create new products.
Disadvantages
- Difficult to analyze large-scale data.
- The prediction may vary due to environmental changes or relationship changes.
- People’s behavior may change over time. A model that works now may not work in the future. So, it’s important to keep updating the model so it works with how people behave.
- Difficult to recognize the correlation.
- Finding the right algorithm to solve a problem can be tricky.
FAQs
How will you differentiate between predictive analytics and prescriptive analytics?
Predictive analytics helps you plan for the future using data. It can tell you what might happen in the future. Prescriptive analytics gives you advice about what to do based on the collected data.
Which tool is used in the predictive analysis?
It offers four different kinds of services. These are SAS Visual Data Science, SAS Data Science Programming, SAS Visual Data Decisioning, and SAS Visual Machine Learning.
How do you differentiate predictive analysis and forecasting?
Forecasting is predicting what might happen in the future by looking at data. For example, you could use data from past years to try and guess how much money a company will make this year. The predictive analysis takes information from different sources to determine how things might change in the future, not just one number.
How does descriptive analytics differ from predictive analytics?
Descriptive analytics tell us what happened in the past. Predictive analytics tell us what could happen in the future.
Conclusion
Predictive analysis is a multifaceted approach for forecasting future behavior based on several variables. Due to this reason, it can be implemented in many different areas, such as healthcare, advertising, finance, and marketing.
Although the technology can help gain insights into customers and their behavior, it poses some issues, such as privacy concerns.
Predictive analysis can generate accurate forecasts and predictions, improving overall operational efficiency for businesses, but it also requires proper data collection.
We hope this post is useful to you in understanding predictive analytics.