Machine learning in demand forecasting uses algorithms that learn patterns from historical sales together with prices, promotions, holidays and other outside signals, then predict future demand from them. In the M5 competition, run on 42,840 Walmart sales series, the winning machine learning method forecast 22.4% more accurately than the strongest statistical benchmark.
That headline hides the finding that matters most to a planner. The same competition shows the advantage is roughly 40% at total-company level but only about 3% at the individual store and item level, which is exactly where replenishment orders are raised. This page sets out what the published evidence supports, which algorithms actually won, how to measure whether your own forecast improved, and where machine learning does not pay for itself.
How this page was built: the accuracy figures come from the M5 Accuracy competition paper by Spyros Makridakis, Evangelos Spiliotis and Vassilios Assimakopoulos, published in the International Journal of Forecasting, read directly rather than quoted from summaries. Vendor and product status was re-checked against each vendor’s own site on 11 September 2026. Where a number could not be traced to a primary source, it is not published here.
What is Machine Learning (ML)?
It is a subsection of artificial intelligence that analyzes data to learn from it and make predictions or decisions.
Machine learning algorithms can be used to understand and improve from experience automatically. That makes them very effective in demand forecasting, which can be used to predict future demand trends based on past data.
What is demand forecasting?
Demand forecasting predicts how much of a particular product or service customers will demand over a specific period. Demand forecasting is an important part of business supply planning.
It helps businesses make informed decisions about production, inventory levels, marketing strategies, financial planning, and other aspects that depend on customer demand.
Why is machine learning so effective in demand forecasting?
Machine learning is effective in demand forecasting because it can learn from past data to predict future demand trends. It makes it very accurate and efficient at forecasting demands. This means
- You can avoid some of the traditional problems with planning, like long wait times, high transport costs, too much inventory, and bad decisions because of inaccurate forecasts.
- Machine learning models help us improve forecast accuracy and free up planners’ time so they can focus on more important products or gather more information at the last minute.
Our list of online calculators helps you to do demand forecasting
Applications of machine learning in demand forecasting
Some real-world applications of machine learning in demand forecasting include:
- Predicting consumer demand for new products
- Forecasting sales for retail businesses
- Forecasting energy demand
- Predicting demand for transportation services
We will discuss each of these applications in more detail below.
Predicting consumer demand for new products
Machine learning can be used to predict consumer demand for new products. For example, You can use machine learning to analyze past sales data and identify patterns that may indicate how consumers will respond to a new product.
This information can then be used to forecast future sales of the product.
Forecasting sales for retail businesses
Machine learning is helpful for forecasting sales for retail businesses. Retail businesses generate many data, such as point-of-sale data, that can be used to train machine learning models.
You can use these models to predict future sales based on historical sales data, weather conditions, and holidays.
Forecasting energy demand
You can utilize ML to analyze past energy consumption data and identify patterns that may indicate how energy demand will change. So you can use this information to forecast future energy demand.
Predicting demand for transportation services
To predict demand for transportation services, you can use machine learning. For example, it helps to analyze past data on taxi rides and identify patterns that may indicate how demand for taxi services will change.
That information can then be used to forecast future demand for taxi services.
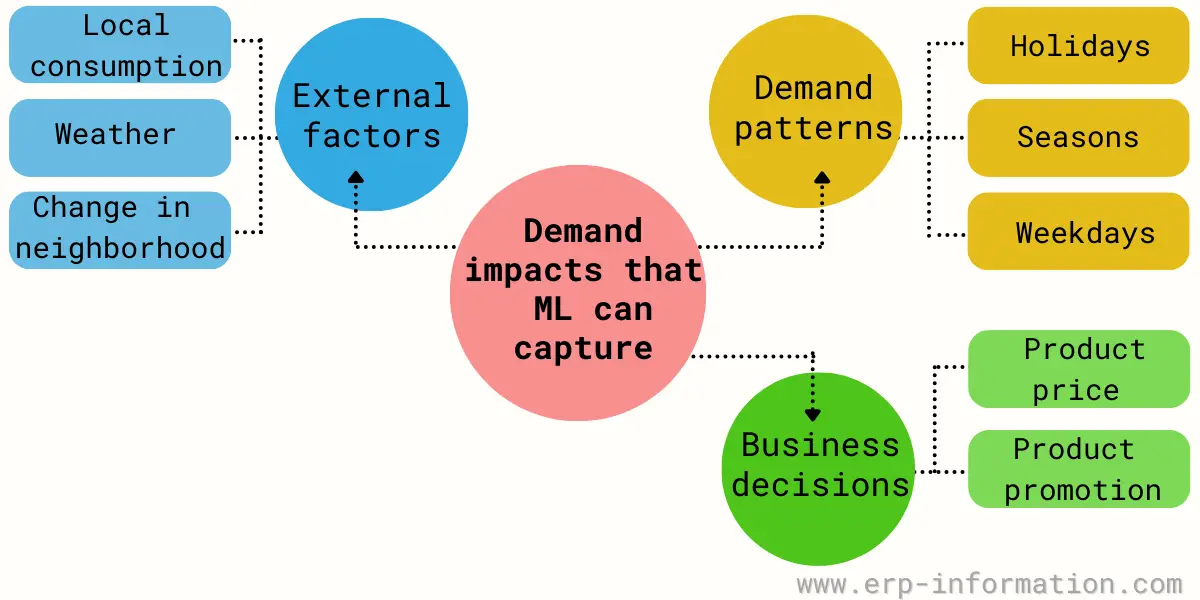
Demand impacts that ML can capture
- Demand patterns: ML captures variations in demands based on seasons, weekdays, and holidays
- Business decisions: Changing product prices and promotion of products also impact on DEMAND that ML will collect
- External factors: Weather and local consumption of the product will affect demand.
Benefits
There are many benefits to using machine learning for demand forecasting, including the following:
- Speed processing of data – Machine learning collects data automatically. Hence you will get all the data very quickly.
- Increased accuracy – Machine learning can accurately predict demand patterns based on past data, which can help businesses more accurately forecast future needs and better allocate resources.
- Reduced costs – Machine learning can help reduce the number of wasted resources due to over or under-stocking, which leads to significant savings for businesses.
- Improved decision-making – By providing accurate forecasts, machine learning can help businesses make better inventory levels, pricing, production planning, and more decisions. That helps companies stay competitive and improve their bottom line.
How to get started with Machine Learning for demand forecasting?
Here are a few things you need to do to get started with machine learning for demand forecasting.
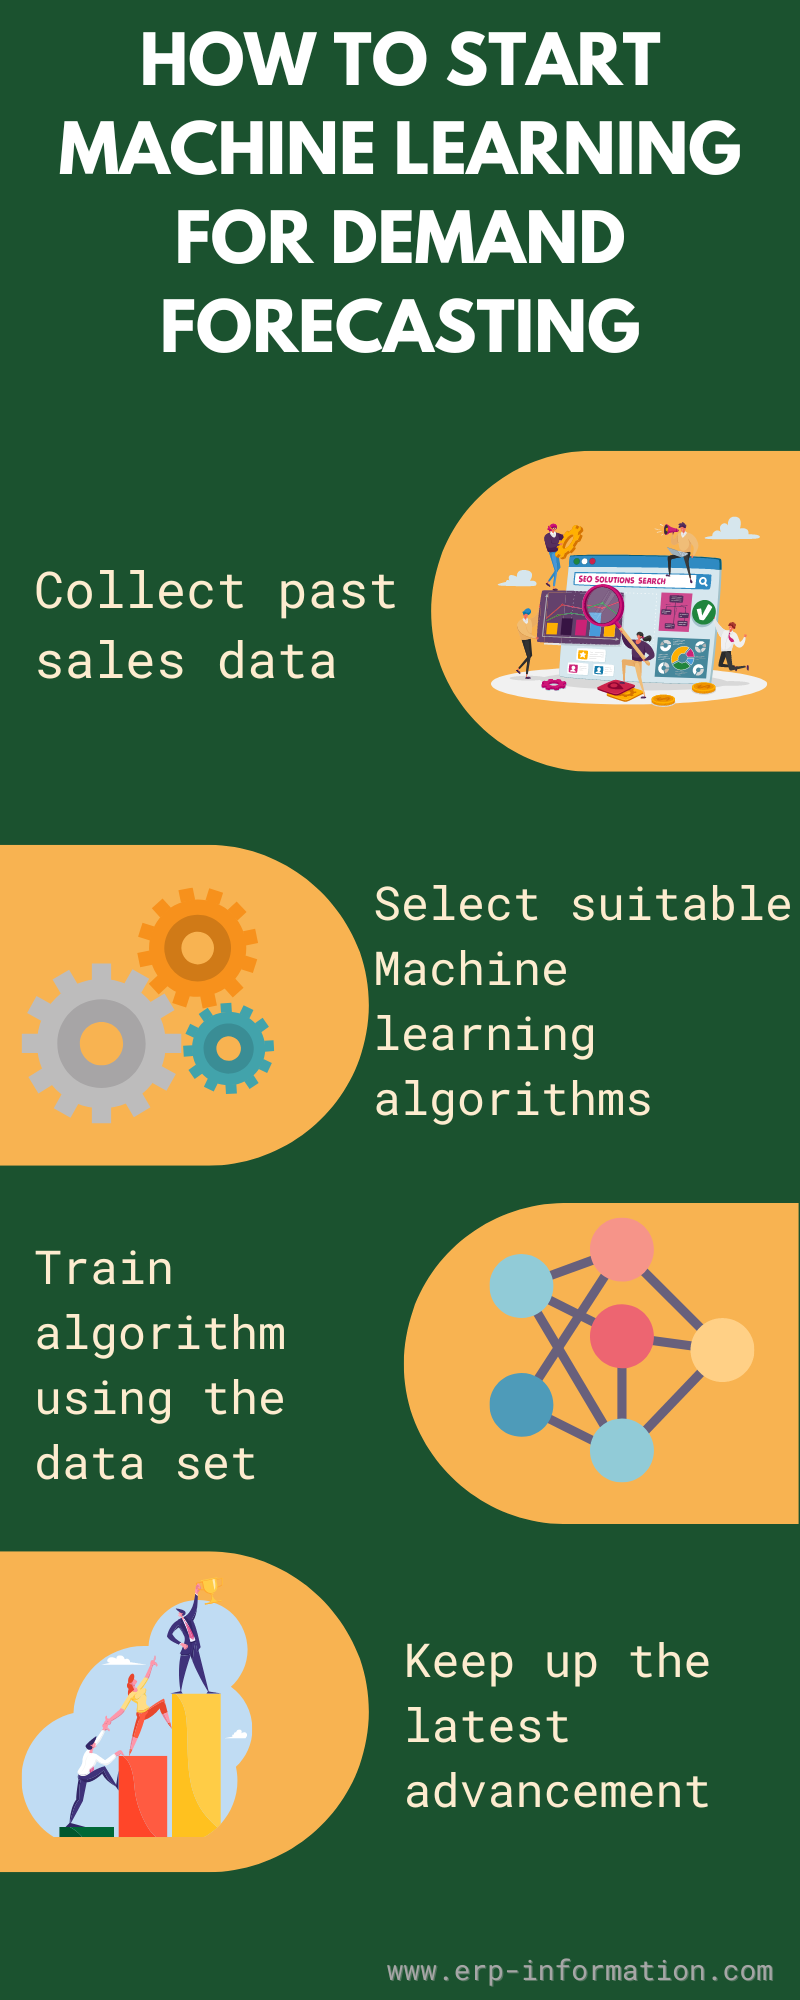
Collect past sales data
First, you need to gather data on past sales. This data can train machine learning models to predict future demand. You can then use these models to help inform your business decisions about inventory and production planning.
Select suitable machine learning algorithms
Several algorithm families are used for demand forecasting. The practical starting points are linear regression, gradient boosted decision trees such as LightGBM and XGBoost, and neural networks. Note that logistic regression is a classification algorithm, used to predict a category rather than a quantity, so it is not a demand forecasting method despite often appearing on lists of them.
You can also use machine learning algorithms like neural networks and deep learning for more complex forecasting tasks.
Train algorithm using the data set
Once you’ve selected a machine learning algorithm, you must train it using your data set. That involves feeding the algorithm examples of past data and telling it what pattern to look for. The algorithm will then use this information to predict future demand.
Keep up the latest advancement
Machine learning is constantly evolving, and the techniques that work the best today may not work tomorrow. So it’s essential to keep up with the latest advancements to stay ahead of the competition.
Before committing to a model, establish the baseline you intend to beat. Run a seasonal naive and an exponential smoothing forecast on the same history and the same error measure, and treat those numbers as the bar. Most projects that disappoint never established one.
Which machine learning algorithms are used for demand forecasting?
Gradient boosted decision trees are the algorithm to try first, and LightGBM is the specific implementation that won. The M5 organisers record that most of the top 50 methods used LightGBM, and every one of the five winning entries was built on it or on neural networks trained across many series at once. Regression analysis remains the baseline these methods are measured against.
| Algorithm family | Representative method | What it suits | Evidence from M5 |
|---|---|---|---|
| Gradient boosted trees | LightGBM, XGBoost | Many correlated series with prices, promotions and calendar features | Used by most of the top 50; all five winners built on it |
| Deep learning for sequences | LSTM, DeepAR, N-BEATS | Long histories, complex seasonality, when you have engineering capacity | 3rd place combined 43 LSTM networks; 2nd place used N-BEATS to adjust LightGBM |
| Exponential smoothing | ES, Holt-Winters | Stable, aggregated series; the benchmark you must beat | Only 7.5% of 5,507 teams beat a well-built exponential smoothing benchmark |
| ARIMA family | ARIMA, ARIMAX | Series with clear autocorrelation, where drivers can be added | ARIMAX was 13% more accurate than ARIMA without external variables |
| Intermittent demand methods | Croston and variants | Slow-moving parts with many zero-sales periods | Seasonal naive was on average 11.5% more accurate than Croston |
Two design choices mattered more than the algorithm itself. The first is cross-learning, training one model across many series instead of one model per product: all 50 of the top methods did this. The second is combining. The winner, YeonJun Im, averaged 220 LightGBM models with equal weights rather than tuning a single best model.
How much does machine learning actually improve forecast accuracy?
The best public evidence is the M5 Accuracy competition, run on Kaggle from 3 March to 30 June 2020. It asked 7,092 participants in 5,507 teams from 101 countries to forecast 28 days ahead across 42,840 hierarchical series of Walmart unit sales, 30,490 of them at individual product and store level. Teams could use prices, promotions and special events as well as sales history.
Two results are worth knowing before funding a project.
First, beating a good statistical baseline is harder than it sounds. Of the 5,507 teams, 2,666 (48.4%) beat a naive forecast and 1,972 (35.8%) beat a seasonal naive one, but only 415 teams, or 7.5%, beat the competition’s strongest statistical benchmark, an automatically selected exponential smoothing model. The competition organisers write that this was nonetheless a turning point:
M5 is, therefore, the first competition where all top-performing methods were both “pure” ML ones and significantly better than all statistical benchmarks and their combinations.
Makridakis, Spiliotis and Assimakopoulos, The M5 Accuracy competition: Results, findings and conclusions
Second, the gain depends almost entirely on how aggregated the forecast is. Averaged across the top 50 methods, the improvement over the best benchmark was about 40% at total-company level, roughly 23% at state and category level, and about 3% at the three lowest levels, which include product-store. The authors are explicit about it:
The gains of the top-performing methods mainly refer to the top and middle parts of the hierarchies, and are rather limited in terms of WRMSSE at product, product-State, and product-store levels.
Makridakis, Spiliotis and Assimakopoulos, M5 Accuracy competition
| Forecast level | Average accuracy gain over the best statistical benchmark | What it is used for |
|---|---|---|
| Total company (level 1) | About 40% | Budgeting, capacity and financial planning |
| State and category (levels 5 to 7) | About 23% | Distribution centre planning, category buying |
| Product, product-state, product-store (levels 10 to 12) | About 3% | Store replenishment and safety stock |
The practical reading is that machine learning pays best where forecasts are aggregated and money is committed in advance, and pays least at the store shelf. It also means a vendor accuracy claim is close to meaningless unless it states the level it was measured at. Ask for that before comparing quotes.
For context, the winning submissions in the earlier M3 and M4 competitions improved on their benchmarks by less than 10%. The M5 winner, YeonJun Im, reached 22.4%, and every one of the top 50 improved by at least 14.2%.
How to measure whether your forecast improved
Choose the error measure before you choose the model, because the wrong measure will report success that inventory never sees. The common trap is MAPE.
| Measure | How it behaves | Use it when |
|---|---|---|
| MAPE, mean absolute percentage error | Divides by actual demand, so it is undefined whenever demand is zero and explodes when demand is small | Aggregated, always-positive series only. Avoid at store-item level |
| WAPE, weighted absolute percentage error | Divides total error by total demand, so zero-demand periods are handled and big sellers carry more weight | The usual default for retail and distribution planning |
| RMSSE and WRMSSE | Scales error against a naive forecast on the same series, so results compare across products | Comparing methods across a catalogue. This is what M5 used |
| Bias, mean error | Shows persistent over or under-forecasting, which accuracy measures hide | Always, alongside one of the above |
Two further habits separated the M5 winners from the rest. They validated on at least the last four 28-day windows of history rather than a single holdout, and they tracked the stability of results as well as the average. A significant number of teams had produced a better forecast at some point during the competition but failed to select it, because a single validation window had misled them.
Slow-moving and intermittent demand
Spare parts and long-tail catalogue items sell in scattered single units with long runs of zeros, and this is the case most forecasting projects underestimate. M5 was the first M competition to include such series deliberately.
The result is a useful corrective. Croston’s method, the technique most textbooks prescribe for intermittent demand, was on average 11.5% less accurate than a seasonal naive forecast on this data. If you are running Croston today because a textbook recommended it, benchmark it against seasonal naive before assuming it helps. The winning machine learning entries handled these series differently again, by optimising for the Tweedie distribution, which is built for data with a spike of zeros and a long right tail.
Limits of machine learning in demand forecasting
Machine learning can be very beneficial to a business in demand forecasting, but there are some limits to its abilities.
- First, machine learning is only as good as the data it has been trained on. If the data set is not large or varied enough, the machine learning model may not be able to identify all the patterns in the data. That could lead to inaccurate predictions. The machine learning algorithm will not produce accurate results if the data is inaccurate or incomplete.
- Second, machine learning models can be very sensitive to changes in the data. Therefore, the machine learning model may not produce accurate predictions if the data set is updated or changed.
- Third, machine learning models can be expensive to build and maintain. Training a machine learning model can be time-consuming and require many resources. And once the model is created, it needs to be constantly monitored and updated to remain accurate.
Best practices of machine learning in demand forecasting
Businesses should remember a few best practices when using machine learning for demand forecasting.
Select the suitable ML algorithm
First, selecting the suitable machine learning algorithm for the problem at hand is essential.
Each machine learning algorithm has its strengths and weaknesses, so it is crucial to choose the algorithm that will work best for the specific data set and problem.
Evaluate machine learning model results
Second, it is crucial to evaluate the machine learning model results carefully. The machine learning model should be tested against a data set entirely separate from the data set used to train the model.
That will help to ensure that the machine learning model is accurate.
Monitor machine learning model
Third, continuously updating and monitoring the machine learning model is important. The machine learning model should be updated regularly to reflect changes in the data set. And if there are any errors in the machine learning model, they should be corrected immediately.
Ready to adjust forecasts
Finally, it is essential to remember that machine learning is not a silver bullet. No machine learning algorithm is perfect, so businesses should always be prepared to adjust their forecasts if necessary.
Best Machine learning software for Demand forecasting
The tools below are often listed together, but they are not the same kind of product and most are not demand planning systems. The table states what each one actually is, because choosing a statistics package when you needed a planning system is the most common and most expensive mistake in this category. Status re-checked against each vendor’s own site on 11 September 2026.
| Tool | What it actually is | Fit for demand forecasting |
|---|---|---|
| Minitab | Statistical analysis package | Analysis and time series modelling, not a planning system |
| Statgraphics Centurion | Statistical analysis package | Forecasting procedures for analysts, no replenishment layer |
| Google Cloud BigQuery | Cloud data warehouse with built-in model training | Where the data and models live, not a planner’s workspace |
| Valohai | MLOps platform for training and deploying models | Infrastructure for a team building its own models |
| Intersect Labs | No-code platform for building models from spreadsheets | Prototyping without a data science team |
| Neuton | Now Nordic Semiconductor edge AI tooling, not a forecasting product | Not applicable, see below |
| TADA | Supply chain execution and visibility software | Supply chain platform with demand capabilities |
| SAS Customer Intelligence 360 | Marketing analytics suite | Marketing response, not supply planning |
| OpenText Magellan | Analytics and content-analysis platform | General analytics, not demand planning |
Two status corrections that most lists still get wrong:
- Neuton is no longer a general AutoML product. Nordic Semiconductor announced on 17 June 2025 that it had acquired Neuton.AI’s intellectual property and core assets to build TinyML models, typically under 5 KB, for its nRF microcontrollers. The neuton.ai address now redirects to Nordic’s edge AI lab. It is embedded AI tooling, not demand forecasting software.
- Amazon Forecast is closed to new customers. AWS states that it “made the decision to close new customer access to Amazon Forecast, effective July 29, 2024”, that existing customers may continue to use it, and that it does not plan to introduce new features. AWS points new users to Amazon SageMaker Canvas. AWS has not published an end-of-support date, so we do not quote one.
If what you need is a demand planning system rather than a modelling tool, the products to shortlist are the supply chain planning suites, and the question to put to each vendor is the one from the accuracy section above: at which aggregation level was your published accuracy figure measured?
- Minitab
- Statgraphics Centurion
- Google Cloud BigQuery
- Prime AI
- Valohai
- Intersect Labs
- Neuton AutoML
- TADA
- SAS Customer Intelligence 360
- OpenText Magellan
FAQs
Which machine learning model is used for demand forecasting?
Gradient boosted decision trees, and LightGBM in particular, are the most widely used. In the M5 competition on Walmart data, most of the top 50 methods used LightGBM and all five winning entries were built on it or on neural networks trained across many series at once. Neural approaches such as LSTM, DeepAR and N-BEATS also placed highly.
How much more accurate is machine learning than traditional demand forecasting?
It depends almost entirely on the aggregation level. In the M5 competition the top 50 machine learning methods beat the strongest statistical benchmark by about 40% at total-company level, about 23% at state and category level, and only about 3% at product-store level. The winning method was 22.4% better overall.
Is machine learning always better than exponential smoothing for demand forecasting?
No. In the M5 competition only 415 of 5,507 teams, or 7.5%, beat an automatically selected exponential smoothing benchmark. Exponential smoothing remains a strong and cheap baseline, especially at product and store level, and any machine learning project should be measured against it.
Which accuracy metric should I use for demand forecasting?
Use WAPE for most retail and distribution planning, because it handles periods of zero demand and weights high-volume items properly. Avoid MAPE at store-item level, as it is undefined when demand is zero. RMSSE, used in the M5 competition, is best for comparing methods across a catalogue. Always report bias alongside accuracy.
What data do you need for machine learning demand forecasting?
Historical sales at the level you want to forecast, plus the drivers that move demand: prices, promotions, holidays and special events. In M5 every winning submission used this external information, and adding it to conventional models helped too, with ARIMAX 13% more accurate than ARIMA without external variables.
Conclusion
Machine learning now produces the most accurate retail demand forecasts available, and the M5 competition settled that question on public data. The honest qualification is that the advantage is concentrated where forecasts are aggregated, worth roughly 40% at company level and about 3% at the store shelf.
So the sensible order of work is to fix the measurement first, benchmark against exponential smoothing and seasonal naive honestly, and only then decide whether a LightGBM model trained across your whole catalogue earns its keep. Only 7.5% of 5,507 expert teams beat a well-built statistical baseline, which is a reasonable prior for an in-house first attempt.
Sources
- Makridakis, S., Spiliotis, E. and Assimakopoulos, V. The M5 Accuracy competition: Results, findings and conclusions, International Journal of Forecasting, volume 38, issue 4.
- Makridakis Open Forecasting Center, the M5 competition, and the M5-methods repository holding the winning teams’ code.
- Amazon Web Services, Transition your Amazon Forecast usage to Amazon SageMaker Canvas.
- Nordic Semiconductor, Nordic Semiconductor accelerates edge AI leadership with acquisition of Neuton.AI, 17 June 2025.
- LightGBM documentation, Microsoft.
Using Google Search? Add erp-information.com as a preferred source.