Regression analysis is a statistical tool that plays a vital role in understanding and quantifying relationships between variables. It aids in predictive modeling, helping businesses, researchers, and analysts make informed decisions based on data-driven insights.
By examining how one or more independent variables influence a dependent variable, regression analysis offers valuable insights into trends, patterns, and dependencies within datasets.
Whether in economics, finance, healthcare, or social sciences, regression analysis helps in determining the underlying dynamics of real-world phenomena and making accurate forecasts.
This blog post will teach you the definition of regression analysis, procedures for selecting variables, how it works, its types, and uses; we’ll also provide tips while working with it.
What is Regression Analysis?
Regression analysis is a technique used in statistics that looks at how one or more independent variables relate to a dependent variable. It helps us understand how changes in the independent variables affect the dependent variable.
By analyzing data and creating a regression model, we can gain insights into patterns, trends, and the strength of connections. There are different forms of regression analysis, including linear regression, logistic regression, and multiple regression, which are used depending on the type of relationships and research questions being explored.
If there are two variables, the variable that acts as the basis of estimation is the independent variable. The variable whose value is to be estimated is known as the dependent variable.
The dependent variable is also popular as a predictor, response, and endogenous variable, while the independent variable is an explanatory, regressor, and exogenous variable.
You can also use it to figure out what will happen in the future if things stay the same. This is a powerful tool that people use in business and social sciences.

How does it work?
- The first step in regression analysis is identifying the independent and dependent variables. The independent variable is the factor you are trying to predict or explain, while the dependent variable is the outcome you are trying to measure.
- The second step is to calculate the linear regression equation. This equation will show the relationship between the independent and dependent variables.
- The third step is to perform a regression analysis of your data. That will determine whether the linear regression equation fits your data well. If it is not, you may need to adjust the equation accordingly.
Three Procedures for Selecting Variables
- Stepwise regression – The type of regression performed to determine which variables in the regression equation are significant predictors of the dependent variable.
- Backward elimination – A form of regression used to remove independent variables from a model one at a time.
- Forward selection – This method starts with no predictor (independent) variables and adds them individually until the model improves.
Regression Analysis Types
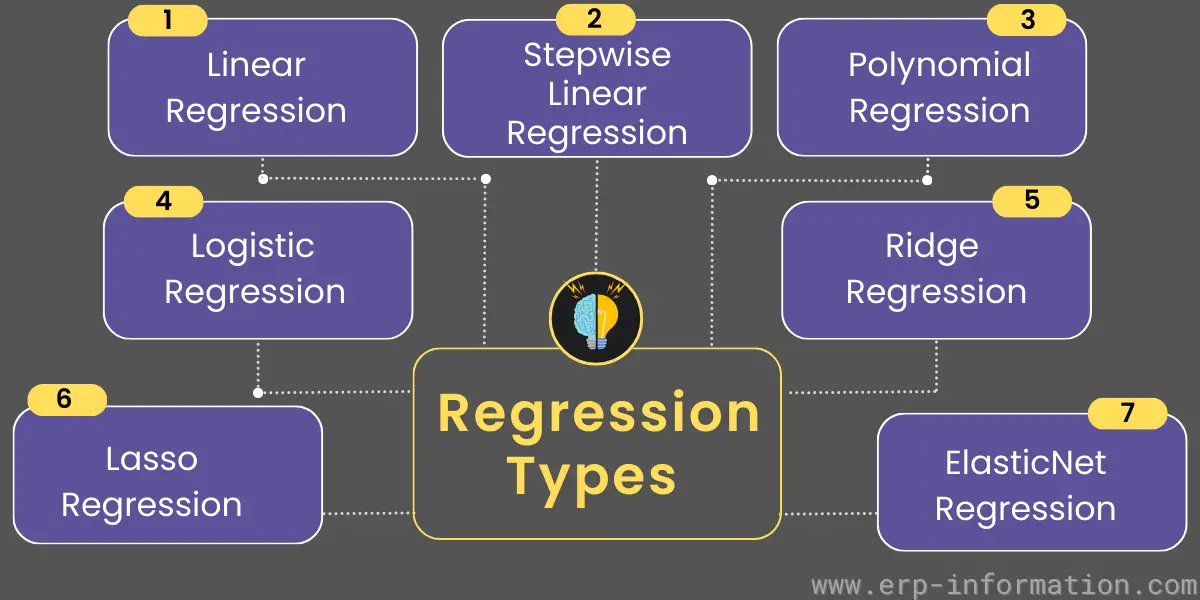
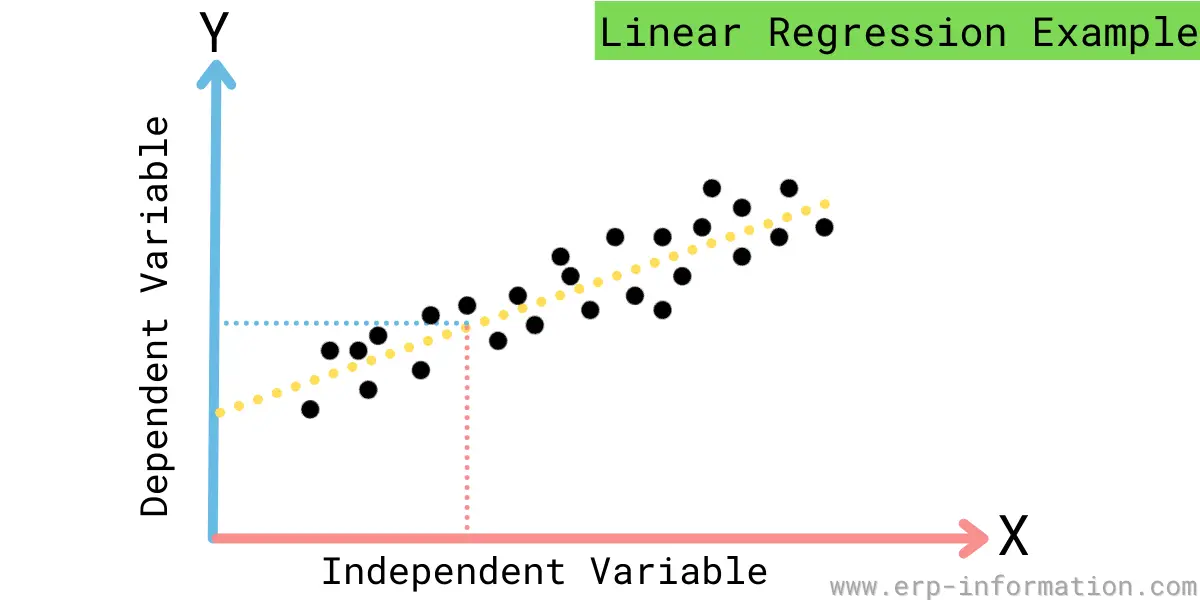
1. Linear Regression
In statistics, linear regression is a method to predict the value of an outcome variable based on one or more predictor variables.
The case where there are two predictor variables is called bivariate linear regression, but simple linear regression refers only to the case in which there is a single predictor variable. Therefore, more than two predictor variables would be classified as multivariate linear regression.
There are two kinds of linear regression: Simple and multiple regression.
Simple Regression
Simple regression is the most basic type of regression. There is only one independent variable and one dependent variable in simple regression. Simple regression aims to find the regression line that best fits the data.
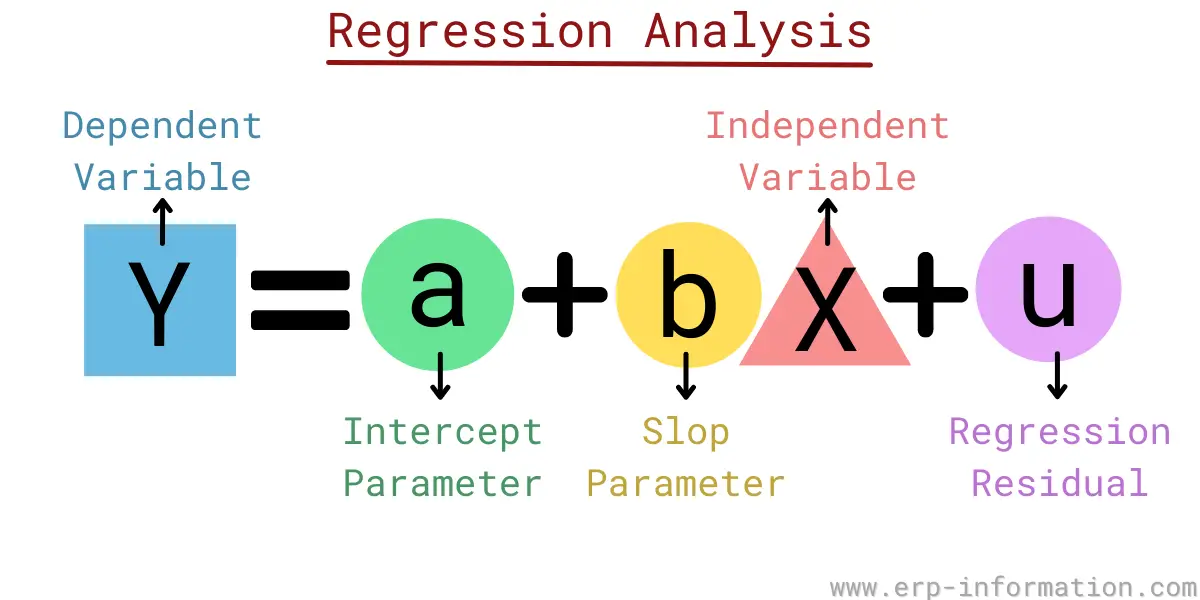
The equation for simple regression:
Y= a+bX+u
Where, Y= Dependent variable
X= Independent(Explanatory) variable
a= Intercept, b= Slop, u= The regression residual
Multiple Regression
Multiple regression is a type of analysis that uses more than one predictor variable to predict the dependent variable. In multiple regression, the model simultaneously fits the data using all the predictor variables. This allows the model to account for the interdependencies among the predictor variables.
The equation for multiple regression:
Y= a+bX1+cX2+dX3+eX4+…….+tXt+u
Where Y= Dependent variable
X1, X2, X3, X4= Independent (Explanatory) variables
a= Intercept, b,c,d= Slops, u= the regression residual
2. Stepwise Regression
Stepwise regression is a type of multiple regression that uses an iterative algorithm to find the best data model. This regression algorithm starts by including all of the predictor variables in the model.
Then, it removes the predictor variable that has the smallest p-value. This process is repeated until you can eliminate no more predictors without increasing the p-value of the model.
3. Logistic Regression
Logistic regression is a statistical method for predicting binary classes. The outcome or target variable is dichotomous.
Dichotomous means there are only two possible classes. For example, it can be used for cancer detection problems. It computes the probability of an event occurrence.
4. Lasso Regression
Lasso Regression is used to find the best-fitting line for a data set. It uses the “least absolute shrinkage and selection operator,” or Lasso, to find the line.
Lasso regression is used when there are many variables in the data set, and the goal is to find the best-fit line while minimizing the number of variables.
5. Ridge Regression
Ridge Regression is a technique used in statistics to reduce the variance of the estimates produced by linear regression models.
Ridge regression incorporates a penalty term in the solved optimization problem. This penalty term increases as the magnitude of the estimated coefficients increases, leading to smaller estimated coefficients.
6. Elastic Net Regression
The Elastic Net is a combination of Ridge Regression and Lasso Regression. The Elastic Net uses both a ridge penalty and a lasso penalty in its optimization problem. This leads to smaller estimated coefficients than either Ridge Regression or Lasso Regression alone.
7. Polynomial Regression
Polynomial regression models the relationship between an outcome variable and one or more predictor variables.
Polynomial regression uses the power of a polynomial function to fit data instead of just using a linear function like in Linear Regression. Polynomial regression can be used for both classification and regression problems.
8. Arbitrary Regression
Arbitrary regression uses a random function to model the relationship between an outcome variable and more predictor variables. Random regression can be used for both classification and regression problems.
It is often used when there is no linear relationship between the predictor and outcome variables.
9. General Regression
General regression uses any combination of the regressions mentioned earlier. General Regression can be used for both classification and regression problems. It allows you to use whichever type(s) of regressions are best suited for your data set.
Applications
- Economics: To study the relationship between variables like income and expenditure, inflation and unemployment rates, or interest rates and economic growth. It helps economists make forecasts and assess the impact of policy changes.
- Finance: Financial analysts use regression analysis to model the relationship between various financial factors, like stock prices and company earnings, to make investment predictions. It also helps in risk assessment and portfolio optimization.
- Marketing: Marketers use regression analysis to understand the impact of advertising campaigns, pricing strategies, and market research on product sales. This insight guides marketing decisions and resource allocation.
- Social Sciences: In sociology and psychology, It helps researchers explore the connection between variables like socioeconomic status and educational attainment, or personality traits and job performance. This aids in understanding human behavior and societal patterns.
- Environmental Science: Environmental scientists employ regression analysis to study relationships between environmental factors such as pollution levels, climate variables, and their impact on ecosystems. It lends a helping hand in environmental management and policy formulation.
- Manufacturing and Quality Control: In manufacturing, It aids optimize processes by identifying factors that impact product quality and efficiency. It’s crucial for ensuring consistency and reducing defects.
- Education: Educators use regression analysis to evaluate the effectiveness of teaching methods, the relationship between classroom size and student performance. Also the impact of interventions on educational outcomes can be studied.
- Healthcare: In medical research, it is used to examine the relationship between factors like diet, exercise, and genetics in health outcomes. It is crucial for identifying risk factors for diseases and optimizing treatment plans.
- Criminal Justice: In criminology, it can be applied to understand the factors contributing to criminal behavior, such as socio-economic conditions and policing strategies.
- Sports Analytics: Regression analysis in sports is utilized to analyze player performance, and understand the impact of various factors on game outcomes. It helps make informed decisions in team management and strategy.
Uses of Regression Analysis
Functional Relationship Between Variables
It plays a significant role in establishing a functional relationship between two variables. It aids researchers and analysts in quantifying the influence of the independent variable on the dependent variable.
Discerning the nature and intensity of this relationship, it yields valuable insights into how alterations in one variable can impact the other.
For instance, in the field of engineering, it aids in identifying the correlation between input voltage and the resulting temperature in an electronic component, thereby enabling engineers to optimize performance and prevent overheating.
Economic and Business Research
It is widely employed in economic and business research. Here the emphasis lies on statistical interpretations due to their ability to reveal cause-and-effect relationships.
In economics, for instance, it proves invaluable in comprehending how changes in factors such as interest rates, consumer spending, or government policies influence critical economic indicators like GDP or unemployment rates.
Similarly, in business research, it is used to assess the impact of diverse factors like marketing expenses, product quality, or market competition on sales and overall profitability.
Coefficient of Correlation and Determination
Regression analysis aids in the determination of the coefficient of correlation (r) and the coefficient of determination (R-squared) through the regression coefficients. The coefficient of correlation then reveals the strength and direction of the relationship between variables.
Also, the coefficient of determination quantifies the proportion of variation in the dependent variable that can be explained by the independent variable(s).
These statistical measures provide valuable insights into the regression model and the extent to which it accurately represents the data. Researchers and analysts rely on these coefficients to evaluate the reliability of their models and to convey the degree of association between variables to stakeholders.
Tips while working with regression analysis
- Always inspect your data to make sure it is appropriate for regression analysis.
- Ensure you understand the type of regression you use and how it works.
- Choose the correct type of regression for your data set.
- Use a linear regression when there is a linear relationship between the predictor and outcome variables.
- Use a polynomial regression when there is a non-linear relationship between the predictor and outcome variables.
- Use a logistic regression when the outcome variable is binary (has only two possible classes).
- Use stepwise regression to find the best model for your data set.
FAQs
What is Regression?
Regression is a statistical term generally used in finance and investing that determines the strength and attribute of the relationship between one dependent variable and a series of independent variables.
Regression can be used for classification and prediction purposes to identify patterns in data and relationships between variables and predict future trends. As a result, regression models are applied across multiple fields, from finance to economics, and have applications in business forecasting.
What is a real-life example of regression analysis?
A grocery store might want to know if the price of eggs is related to the number of eggs sold. They could do a regression analysis to find out. They would gather data on how many eggs are sold each week at different prices and then use a software program to see if a line can be drawn that best predicts the number of eggs sold based on the price of eggs.
If there is a relationship between price and the number of eggs sold, then the grocery store can raise or lower their prices accordingly to sell more or fewer eggs.
What is quantile regression analysis?
It is a statistical technique used to estimate the relationships between dependent variables and one or more independent variables. This technique assesses the impact of an independent variable on the dependent variable across the entire range of independent variables rather than just at its mean.
Conclusion
By understanding how regression works and using it effectively, you can gain insights into your data that can help you make better business decisions. Regression analysis can be used in almost any industry, but economists most frequently use it to predict changes in the economy.
In this post, we have looked at the different types of regression and when you should use each variety. We have also looked at some tips for working with regression analysis. We hope you have found this post helpful!
Reference