
What is ABC Analysis? ABC analysis (sometimes called Pareto classification) is a simple but powerful tool for prioritizing.
The premise behind ABC analysis is that 80% of a company’s sales come from just 20% of its items.
So, by focusing on the “A” items first, companies can maximize their profits by optimizing their stock levels and improving customer service. Therefore, it is mainly used in inventory management.
This article will help you understand ABC analysis with an example. It will discuss the Pareto principle, ABC classification, how to use it in inventory management, and its advantages, disadvantages, best practices, and history.
Categorize your product using our ABC Classification Calculator.
What is an ABC Analysis in Inventory Management?
It is an inventory categorization technique. In this technique, all inventory items are grouped into different categories. These categories are based on the value and quantity of the items.
It can help you make better decisions about your stock and improve your overall inventory management process.
General Electric first introduced the concept of inventory management systems in 1951.
Abbreviation
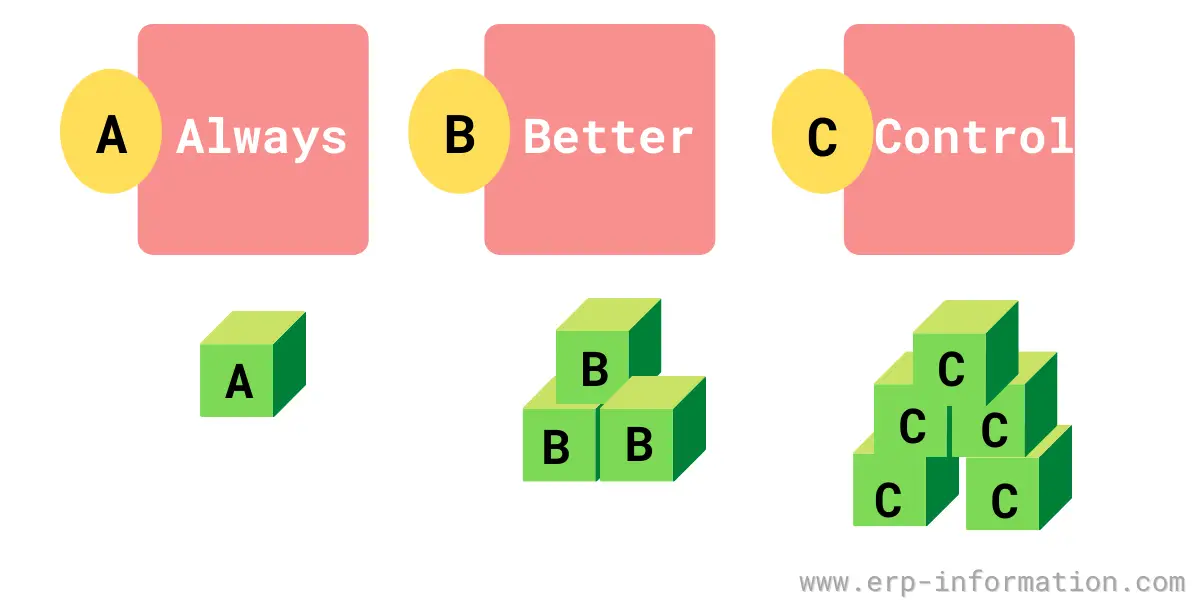
A, B, and C in ABC analysis fullform is Always Better Control.
ABC Analysis Example
Tom runs a coffee shop that has recently expanded its product range from 20 to 100 different types of coffee beans and blends. Recognizing that the coffee business is competitive and that he has invested heavily in his stock, Tom sought a method to streamline his inventory management.
After thorough research, he decided to implement the ABC inventory categorization model to pinpoint which products bring in the most profit.
Tom organized his extensive selection of coffee beans into three categories: A, B, and C, based on their sales volume, price, and demand.
Category A – This category includes the top-selling coffee beans and blends that are crucial to Tom’s business. These items are either in high demand, generate the highest revenue, or are trending among his customers. Tom ensures these products are always well-stocked and prominently featured in his marketing efforts.
Category B – These coffee products are important but not as critical as those in Category A. They have moderate demand or are popular during specific times of the year, such as holiday blends that see a spike in sales around Christmas. Tom keeps a reasonable stock of these items, focusing on them mainly during their peak seasons.
Category C – This category includes coffee beans and blends with lower sales and minimal impact on revenue. These could be specialty beans with niche appeal, uncommon flavor profiles, or older blends that are no longer as popular. Tom allocates minimal effort to these products, keeping only limited stock and focusing his resources on the more profitable items.
By categorizing his coffee beans with the ABC analysis, Tom can concentrate his efforts on the most profitable products, optimize his inventory levels, and enhance his shop’s overall profitability.
The Pareto Principle (80/20rule)
ABC analysis is based on the PARETO PRINCIPLE.
Pareto’s law
An Italian economist Vilfredo Pareto developed this law in the 1800s. He noticed that 20% of the bean plants in his garden generated 80% of the excellent bean pods. This observation caused him to think about unequal allocation patterns everywhere.
80% of the results will come from just 20% of the action.
It is based on the principle that a small percentage of a group determines the vast majority of a result.
The result here may be wealth, cost, quality problems, etc. But, on the other hand, the group may be the number of people, items, etc.
It is often stated as the 80/20 rule.
It is used in inventory counting and quality systems. For example, concentrate on the small 20% number of sources that account for 80% of inventory value or quality issues.
In other words, according to the Pareto principle, 20% of cases result in 80% of the effects. When we apply this to inventory management, 20% of the items contribute to 80% of the costs. Based on this, inventory items are classified into three categories.
Pareto analysis
It is a synonym for ABC analysis. This analysis classifies items into different categories depending on their annual usage.
Pareto distribution
It is a power-law probability distribution. In a large number of real-world situations, we can find it. It is based on the Pareto principle.
ABC Classification / Pareto Classification
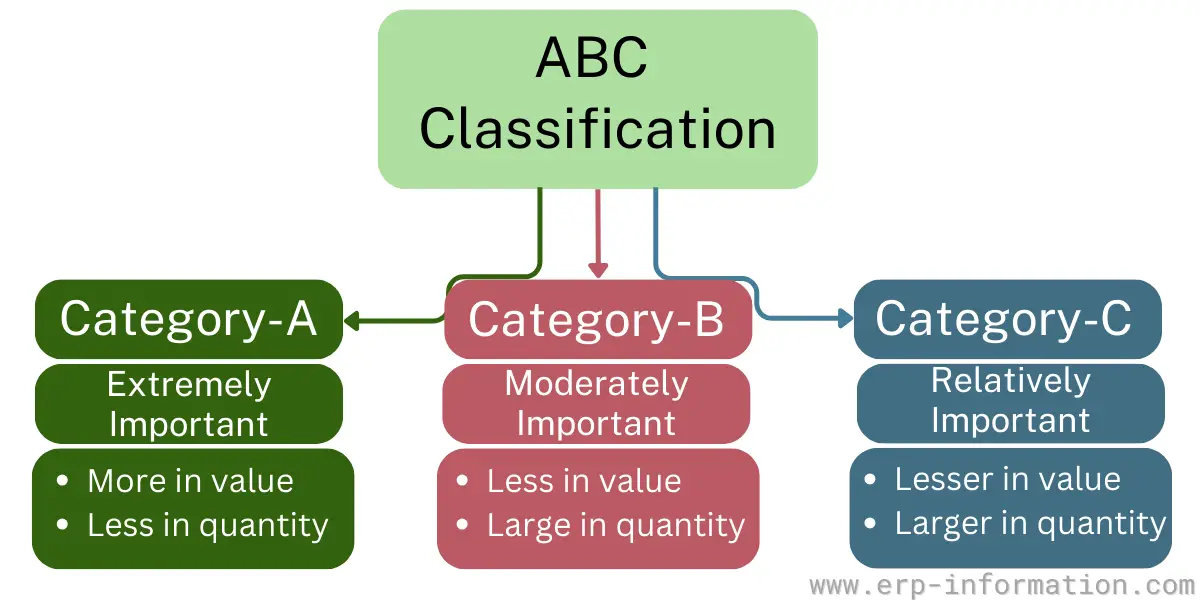
ABC Classification is an inventory control technique that classifies inventory items into three categories based on their priorities.
- A – Extremely important
- B – Moderately important
- C – Relatively important
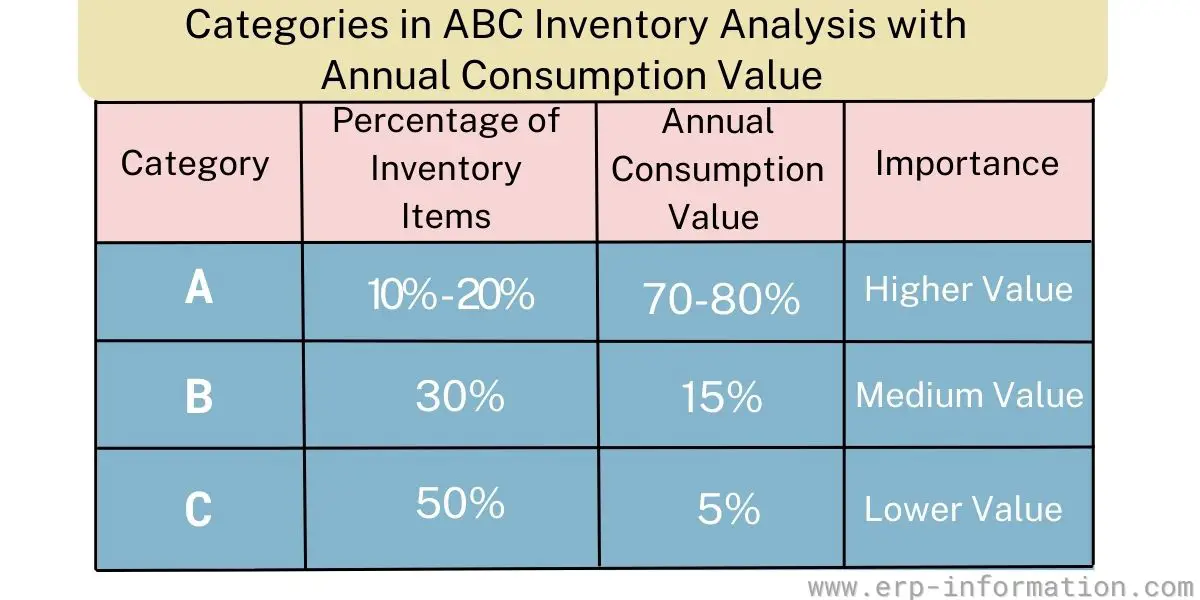
Category ‘A’ items are high-value inventory items with the highest annual usage value. Usually, 10-20% of the inventory items come under group ‘A.’ Therefore, their yearly usage or consumption value is about 70-80%.
Category ‘B’ items have a medium annual consumption value. Usage value is around 15-25%, typically accounting for about 30% of the inventory.
Category ‘C’ items have the lowest consumption value. That is about 5%, accounting for 50% of the total inventory.
It allows management to decide which items should get priority and more attention in the inventory.
Managing inventory involves things like,
- What items need to be ordered
- How much has to be ordered
- When to order
- How much management attention does each item need
These actions depend on the demand for the item and the lead time. Taking these actions every time for each inventory item will lead to inefficiency. That as well as increases cost.
ABC method cuts down the cost involved in checking all inventory items. That is achieved by applying different levels of control for other categories.
How to Perform ABC Analysis in Inventory Management?
Analysis of inventory is a profitability analysis of an inventory item. It’s performed by calculating the total annual cost and recognizing each item’s average sale price per unit.
The process involves the following steps:
- Determine the objective – Determine and set the proper objective so that ABC analysis can be helpful in 2 ways. That decreases procurement costs and optimizes inventory levels.
- Determine the annual usage – Collecting data on annual spending on each inventory item is crucial.
- Sort the inventory items – List the Inventory Items in descending order based on yearly usage value.
- Calculate sales impact – Find out the percentage impact of each inventory item by dividing the annual item cost by the average total of all inventory items spent. The average inventory of each item is calculated by dividing the usage value by two and several orders.
- Categorized the items – Arrange these items in the stock by cumulative annual usage and cumulative percentage. Group these items as Category A, B, and C.
- Monitor the categories – Once you define the categories, then keep monitoring them to confirm your categorization is correct.
Calculation of ABC Inventory Analysis
Use the following formula to calculate ABC inventory analysis.
Annual usage = Unit cost of the item X Number of items sold annually.
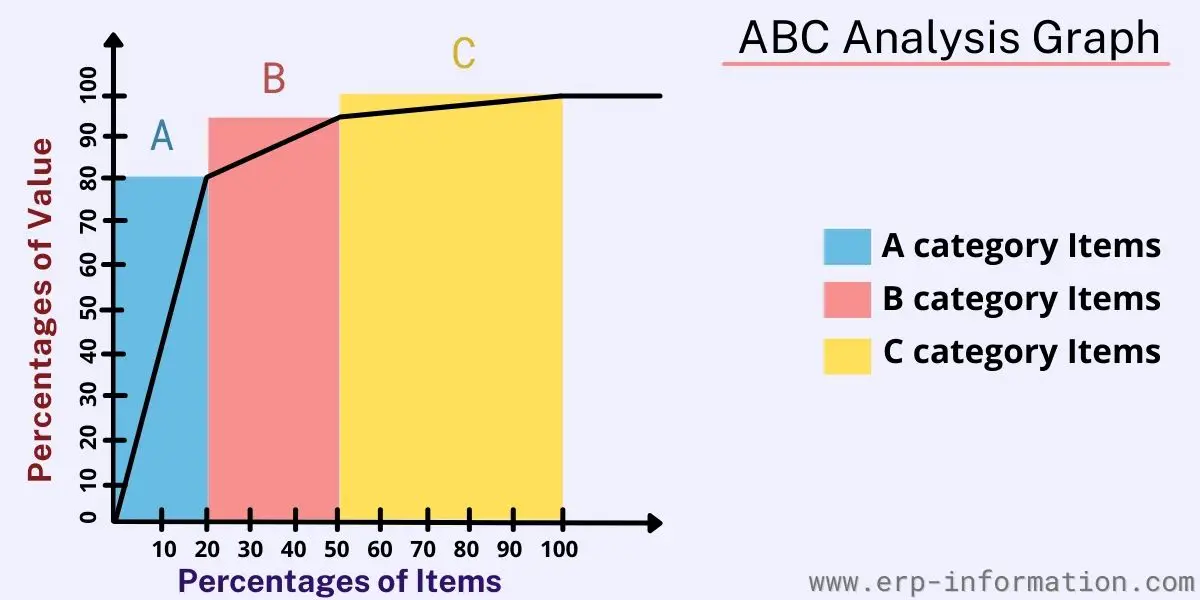
Graphical Representation of ABC Analysis
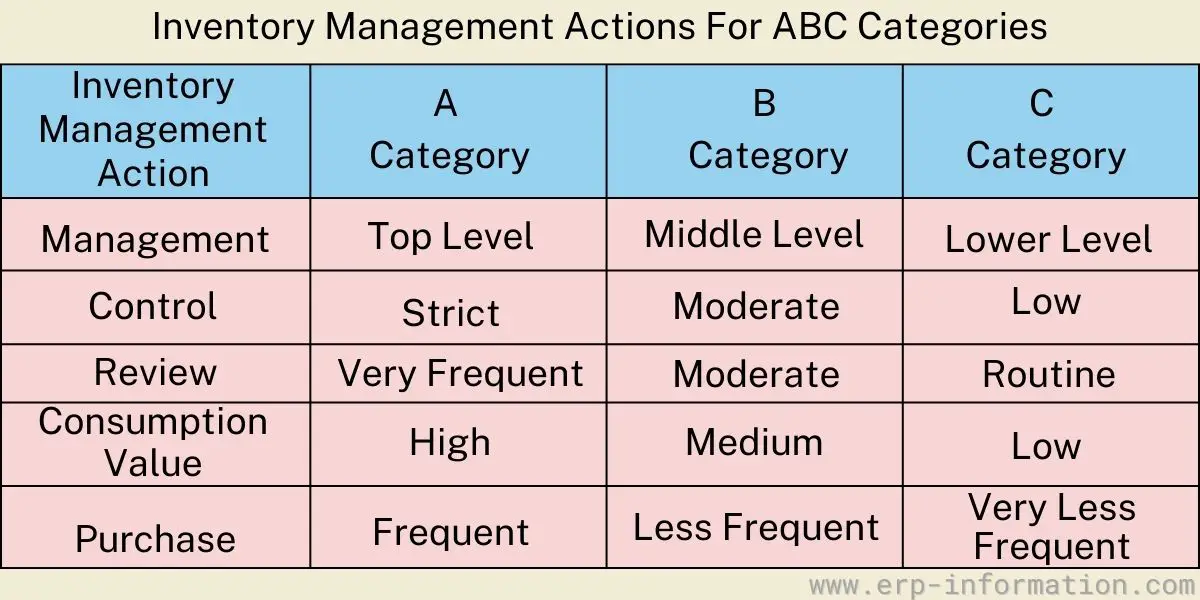
ABC Items Inventory Management Actions
Advantages
ABC analysis offers numerous benefits for effective management and planning of inventory. Many ERP systems will have built-in processes to undertake it.
Selective control over items
Managers can focus their attention on the most critical items in the inventory. By classifying items into A, B, and C categories, where A items are the most valuable, B items are moderately important, and C items are the least significant, managers can prioritize their efforts accordingly.
This selective control ensures that the most important items, which have the highest impact on production, receive the necessary attention and resources.
Efficient inventory management
The ABC classification simplifies the process of inventory management. By reducing the amount of time and effort spent on less critical items, it allows managers to allocate their efforts more efficiently.
Financial forecasting and planning
With a clear understanding of which items are most critical, businesses can make more accurate financial forecasts and plans. Knowing the value and turnover rate of A, B, and C items helps in predicting future inventory needs and financial requirements.
Resource allocation and validation
The ABC system continuously validates the allocation of resources, ensuring that the most important items align with customer demand. This dynamic allocation process helps in optimizing resources, making sure that class A items are always available to meet customer expectations.
Identifying profitable items
By focusing on the profitability of items, the ABC analysis helps businesses identify which products generate the most profit. This insight allows companies to provide exceptional customer service for these high-value items, enhancing customer loyalty and boosting sales.
Reducing storage costs
Effective inventory management using the ABC method also leads to reduced storage costs. By maintaining the exact amount of stock required for A, B, and C categories, businesses avoid the costs associated with overstocking and underutilized storage space.
Disadvantages
- ABC classification is based on the monetary value of the items. Though consumption or economic values are negligible for some things, they could be vital for production.
- It needs periodic updates and reviews. These reviews are required since some inventory items become obsolete or get added in between.
- When a new product is added, it will not have a buying history. Hence it takes work to calculate its value.
- It is not suitable for organizations with stable annual consumption values of inventory by type.
- Organizations should buy special equipment and hire more staff to perform it for more inventory items.
ABC Analysis Best Practices
Have proper classification and monitoring
Always classify the items as per the total profit margin. Keep more expensive products in class A, average expensive items in class B, and less costly items in class C.
Keep monitoring the fast-moving products. Otherwise, there will be a chance of stock-outs.
Allocation of service levels
Allocate the service levels depending on the product class. That means giving more attention to the class A items. Frequently perform cycle counting or any other inventory counting for category A items.
If you review 100 class C items in 1 hour, then review 50 class B items and 10 class A items in 1 hour.
So regular counting of class A items gives you a significant marketing impact and increases the sales performance.
Set key performance indicators for each class
Set a clear-cut key performance indicator (KPI) for each class, along with reports and dashboards.
Evaluate the performance
Keep on analyzing the performance of each class item in the market and recategorize the items based on their cost and performance.
Keep track of inventory shipment
Carefully monitor the shipment time and receive inventory time from one location to another.
Re-categorization of products
Depending on the market changes, demand and cost of the product change. Hence it would be best if you reclassified your inventory intermittently.
Determine the relationship between sales and inventory
As the sales increase, demand for the product also increases, so you need to increase the stock to avoid stock-outs.
It is valid for decreasing the demand for an item also. So keep on validating the item’s price and review the stock levels.
Usage of technology
Inventory managers should use an automated system to retrieve inventory easily, and the system also helps manage lead times and demand planning.
ABC Analysis Use Cases in Different Industries
ABC analysis is an inventory management technique used in various industries and organizations, such as manufacturing, retail, automotive, and warehousing. The analysis provides insight into the value of each item within an inventory or project list.
As a result, it allows managers to allocate resources efficiently by focusing on the most valuable items first. Additionally, it can help managers predict future needs and ensure that the organization’s resources are deployed optimally.
Manufacturing
In the manufacturing industry, the business can increase profit margins by categorizing 20% of the top products. ABC analysis will be used here to determine and prioritize the materials, resources, and time required for those products.
Retail
ABC analysis helps retailers identify profitable products for their business.
Automotive
ABC analysis helps the automotive industry to analyze resource utilization and equipment performance. It also helps automotive manufacturers to get real-time information on raw materials.
Warehousing
ABC analysis helps warehouse managers manage higher-value inventory items and maintain safe stock to avoid stockouts.
History
ABC analysis first emerged in the 1900s by economist Vilfredo Pareto. He developed the famous 80/20 rule, which states that approximately 80% of outcomes come from 20% of causes.
In the 1950s, Joseph M. Juran and W. Edwards Deming brought the ABC analysis to Japan to help the economy of Japan after the war. They are founders of the proponents of quality management.
In the 1960s, Total Quality Management (TQM) used the ABC analysis concept.
In 1974, UPC barcode and scanning came into existence, and in 1981, the Department of Defense started using Barecodes in the inventory control system. In addition, it supported ABC inventory management.
In the 1980s, lean manufacturing was introduced along with the ABC concept.
From the 1990s to the present, the ERP system has supported ABC analysis with other inventory management methods.
FAQs
How can managers use ABC Analysis to prioritize tasks and resources?
Managers can use ABC analysis to prioritize tasks and resources by focusing on the highest-priority items. Then, the analysis assigns a value to each item so managers can quickly identify the most important items.
For example, in an inventory of products, managers may decide that items with a high-value rating should be restocked first, while those with lower ratings can wait until later.
Similarly, when faced with a list of projects, managers can evaluate the urgency of each one and allocate resources accordingly. This method allows organizations to use their resources in the most efficient way possible.
Conclusion
ABC analysis is a technique used to organize inventory based on its importance.
It’s based on the Pareto classification, which says that 80% of your problems come from 20% of your causes. That means you should focus more time and energy on what is most important for business success.
One way to do this with inventory management is by using this analysis to understand where the company will have the most significant return on investment (ROI).
It has been known for many years in the industry. Industries, including manufacturing, hotels, and hospitals, use it and reap benefits. Still, many enterprises have yet to adopt it.
You can use this method to classify not only the inventory. It can also be used with different data. In addition, many organizations apply it in other business processes like purchasing, sales, marketing, quality, and forecasting.
Reference