Statistics play a critical role in the success of businesses in today’s increasingly competitive market. By assessing customer needs and preferences through statistics, businesses can evaluate the effectiveness of their marketing campaigns.
Therefore, understanding statistical analysis and how it is useful to make decisions is essential for staying ahead of the competition.
This blog post will cover everything you need to know about using statistics as part of your business strategy – from exploring statistical analysis and its different types, process, methods, tools, and examples.
So if you’re ready to take your data-driven decision-making skills up a notch, let’s get started!
What is statistical analysis?
Statistical analysis is the process or technique of collecting, analyzing, and interpreting data to gain insights, identify patterns and trends, draw conclusions, and make decisions. It is part of data analytics.
This method focuses on the reduction of bias in data analysis. Statistic analysis is an artificial intelligence tool that helps identify common patterns to transform them into useful statistics.
You can use them to forecast future outcomes based on past performance or make predictions based on current conditions.
Types of statistical analysis
There are two types of analysis. One is descriptive statistics, and the other is inferential or modeling statistics.
1. Descriptive statistics
Descriptive statistics is a set of statistical techniques to summarize and describe data without drawing definite conclusions.
It usually represents in the form of graphs, charts, and tables for easy viewing. In addition, it overviews the characteristics of a dataset, such as the mean, median, mode, range, variance, standard deviation, and interquartile range.
It can also help identify outliers or other patterns in the data. Finally, descriptive statistics are used to help researchers analyze the data and identify important trends and relationships.
2. Inferential statistics
Inferential statistics is a set of statistics that uses data to make predictions and informed decisions. For example, it enables organizations to draw conclusions from a sample of data to estimate a larger population of interest.
In other words, it involves using probability and statistical tests to draw inferences or judge the population being studied. Inferential statistics can help determine the likelihood of a given outcome and the degree of confidence one can place in that estimate.
It is often used to make decisions or predictions about things not directly observed, such as medical diagnosis, identification of a criminal suspect, or forecasting future trends.
Difference between descriptive and inferential statistics
| Descriptive statistics | Inferential statistics |
| Descriptive is used to describe the relationships among different variables in the population. It provides information grouped into the mean, median, and mode of measurement. | Inferential statistics use random sampling of population data to explain and determine the population. |
Process steps of statistical analysis
Embarking on a statistical analysis journey involves several key steps that guide you from raw data to meaningful insights. Here’s an overview of the process steps.
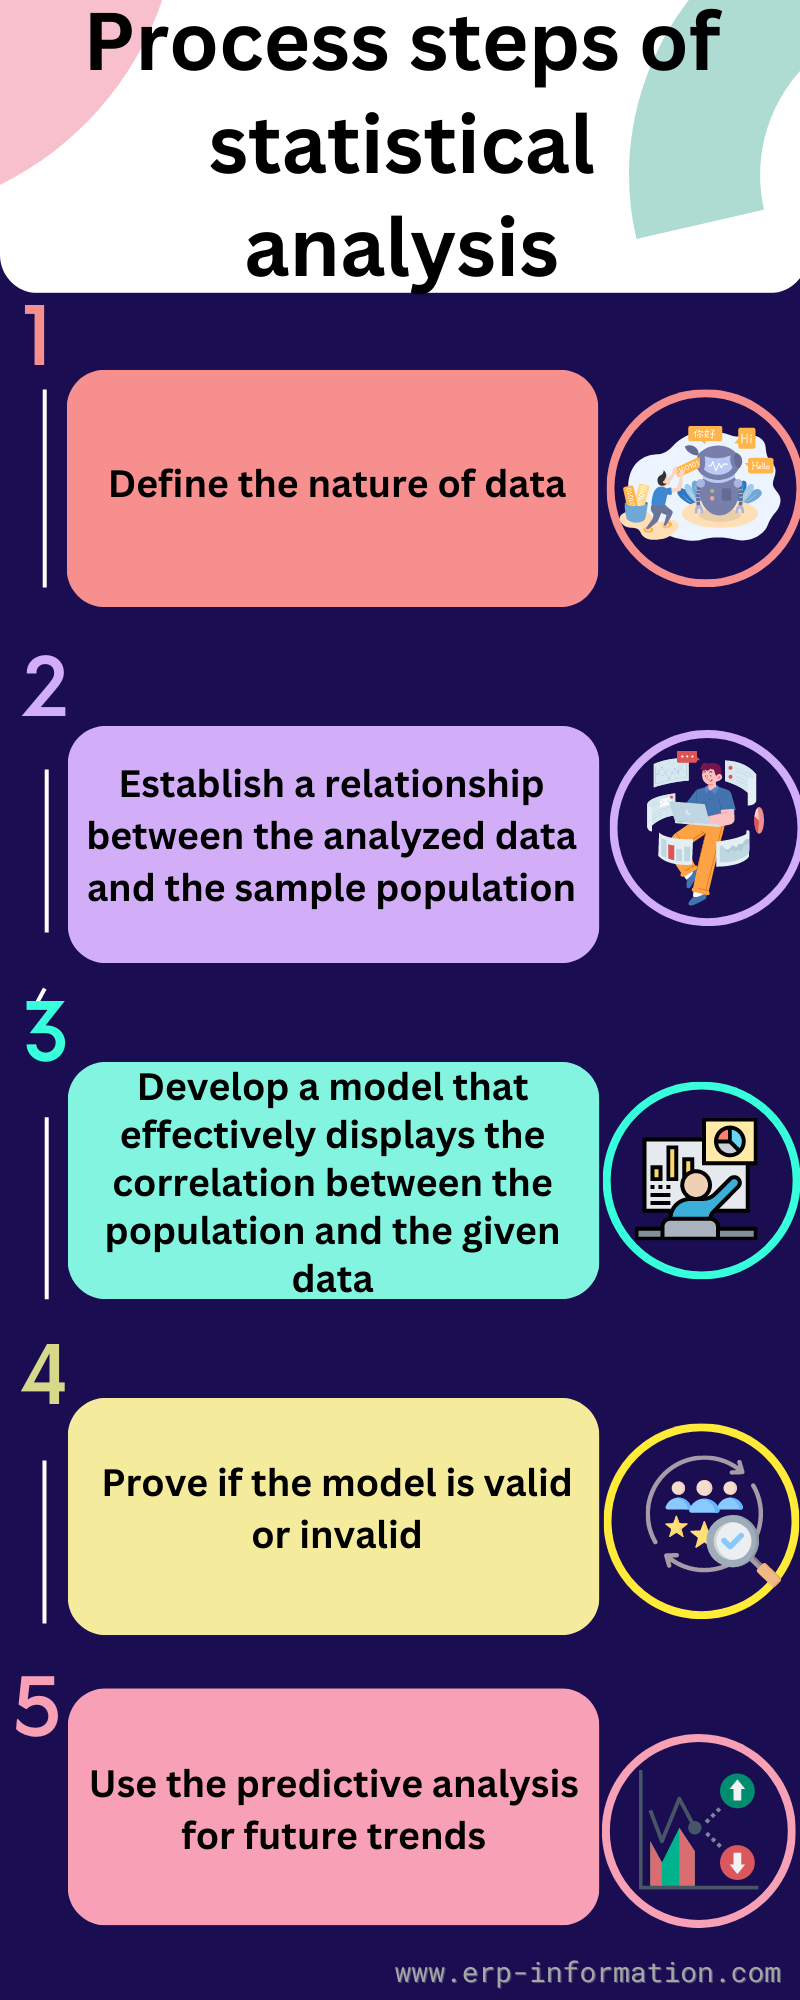
1. Define the nature of data
Clearly define the data that can be analyzed.
Data may consist of numerical values (such as counts, measurements, or responses), qualitative information (such as labels, categories, or subjective opinions), or a combination of both.
Understanding the nature of data is important to analyze it using the appropriate statistical methods accurately.
2. Establish a relationship
Establish a relationship between the analyzed data and the sample population from which the data was collected.
The sample population is the group of individuals or objects from which a data set was taken. It’s important to create a relationship between the data and the population to understand how the results apply to the larger population.
You can do it by documenting potential selection bias, sample size, data representativeness, and other relevant factors that may affect the data.
3. Develop a model
Develop a model that effectively displays and summarizes the correlation between the population and the given data.
Once the nature of the data and its relationship to the population has been established, it’s important to develop a model that accurately displays and summarizes this correlation.
The model should explain any trends or patterns in the data and identify any outliers that may indicate a need for further investigation. That could involve using graphs, charts, tables, or other methods.
4. Prove if the model is valid or invalid
You can determine the validity of a model using statistical tests and validating the results against known data.
These tests measure how closely the model reflects the reality being studied, such as whether relationships between variables hold true or if certain outcomes are likely to occur.
5. Use the predictive analysis for future trends
The predictive analysis forecasts future trends, outcomes, or behaviors. It involves using statistical models and algorithms to determine patterns in the data used to predict future events or outcomes.
This type of analysis can help organizations prepare for upcoming changes and anticipate customer needs.
Real-life examples
Statistics plays a significant role in real-life scenarios of different sectors. Some of them are listed below.
Healthcare
Medical researchers use statistics to evaluate the effectiveness of new treatments, medications, or vaccinations through clinical trials. For example, they can determine if a new drug is safe and effective by comparing treatment outcomes.
Finance
Stock market analysts analyze historical data and identify trends to make investment recommendations or forecast future market movements.
Marketing
Businesses analyze data to identify target markets and develop effective marketing strategies. They also analyze customer feedback to improve products or services. If any organization wants to extend its business, it conducts market analysis to determine market trends.
Manufacturing
Manufacturers utilize statistical process control techniques to monitor production processes, maintain product quality, and minimize defects.
Sports
Coaches and analysts use statistical data to assess player performance, identify strengths and weaknesses, and develop game strategies.
Education
Educational institutions leverage statistical analysis to identify patterns in student performance, allowing them to develop targeted interventions and improve overall learning outcomes.
Politics
Political analysts use statistical methods to estimate public opinion and predict election outcomes. In addition, they can gauge voter preferences and develop campaign strategies by analyzing survey data.
Environmental science
Environment researchers analyze data to study the environmental effect of human activities, such as climate change, deforestation, or pollution.
Statistical analysis methods
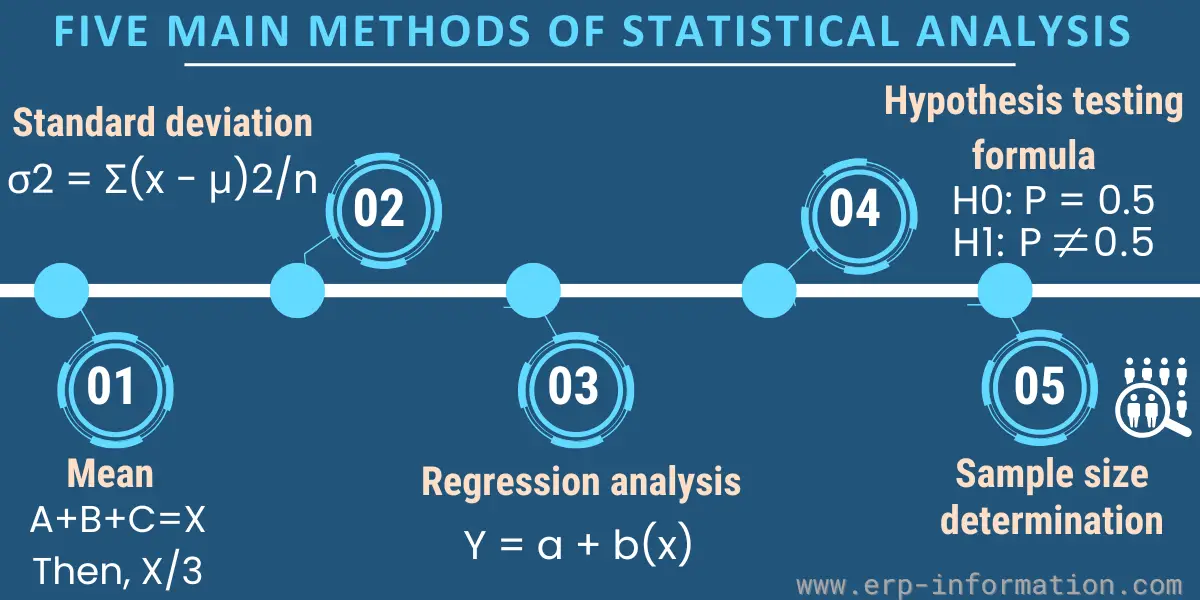
1. Mean
It is the popular method of statistical analysis. It is the average value of the given data set and is very easy to calculate.
You must add the values in the data set and divide them by the number of data points to find the mean.
Example: Find the mean of 18, 30, 12,
Add all numbers: 18+30+12 = 60
Now divide it by the number of data points. That is 3
60/3 = 20 is the mean
Drawback
This method is not always advisable because while working with a large number of data points with many outliers, the mean does not give accurate results.
2. Standard deviation
It is the square root of the variance, representing the dispersion around the mean.
Analysts use this method when they need to determine the data points’ dispersion.
Assume that you are a marketer, do a survey, and want to know if the answers are reliable. To do this, measure how different the answers are from each other. If they are not very different, then the same answers can be expected for more people.
The formula for standard deviation
σ2 = Σ(x − μ)2/n
Drawback
Using only this method to do statistical tests may mislead you to work with too many outliers or abnormal curves.
3. Regression analysis
Regression means the relation between dependent and independent variables.
In regression, changes in one variable affect the other. That means the outcome depends on more than one variable.
The line in regression analysis graphs indicates the robustness of the relationship between the variables and displays trends over a particular period.
The formula for regression analysis
Y = a + b(x)
Drawback
Its downside is that it is not distinctive, which means all the outliers on the regression analysis graph are important. It’s essential to determine why they occur.
The reason for an outlier could be an error during analysis or inappropriate data scaling. However, it’s crucial not to disregard outliers marked on the plot, as they may hold valuable information, such as identifying your highest-selling product.
The regression line can cause one to overlook these outliers and only focus on the trends in data.
4. Hypothesis testing formula
Hypothesis testing is a method of examining whether a conclusion or argument is accurate using a data set. It involves creating an assumption at the start of the research, and the analysis results determine its validity or inaccuracy.
To make a specific claim, the p-value must be interpreted after conducting a statistical hypothesis test.
The formula for the hypothesis test is:
H0: P = 0.5
H1: P ≠ 0.5
Drawback
Common errors, such as the placebo effect, can sometimes obscure and bias hypothesis testing. Statistical analysts may erroneously anticipate a particular outcome, leading them to observe it regardless of the circumstances.
The Hawthorne effect may also occur in this method when people change their behavior because they know that someone is watching them. This is also called the observer effect.
5. Sample size determination
Sample size determination or data sampling is a method used to select a smaller group of data, called a sample, from a larger population in a representative way.
This approach is necessary when the population is too large to analyze entirely. In addition, different techniques are available for data sampling, such as snowball sampling, convenience sampling, and random sampling.
Drawback
If you want to analyze a new variable of data within this method, you must stay on some assumptions. The assumption could be inaccurate. If such an error occurs during the statistical analysis, it can harm the rest of your data analysis.
What is statistical analysis software?
Statistical analysis software is specialized computer programs or tools designed to analyze, manipulate, and visualize data using various statistical techniques.
With the help of artificial intelligence and machine learning, the software does complicated calculations, identifies trends and patterns, and generates charts, graphs, and tables.
Statistical analysis software applications assist researchers, data analysts, and professionals across diverse fields in making informed decisions based on data-driven insights.
Statistical analysis tools
R
It is an open-source software environment for statistical computing and graphics. Statisticians, data scientists, and researchers for data analysis and visualization widely use R.
SPSS (Statistical Package for the Social Sciences)
It was developed by IBM and is a widely used proprietary software package for statistical analysis, particularly in the social sciences. SPSS offers a user-friendly interface and a comprehensive set of statistical tools.
SAS (Statistical Analysis System)
A powerful and flexible software suite for data management, advanced analytics, predictive modeling, and business intelligence. SAS is commonly used in industries such as healthcare, finance, and marketing.
MATLAB
A high-level programming language and interactive environment for numerical computing, data analysis, and visualization.
MATLAB is widely employed in engineering, predictive maintenance, medical research, and finance for its extensive toolboxes and built-in functions.
Microsoft Excel
It is a widely used spreadsheet program that offers basic statistical analysis functions and data visualization tools. While less powerful than dedicated statistical software, Excel is often used for simple analyses and data organization.
Stata
A comprehensive statistical software package that combines data management, statistical analysis, and graphics capabilities. Stata is popular in fields such as economics, sociology, and public health.
Minitab
A user-friendly statistical software package designed for quality improvement and Six Sigma projects. Minitab offers a wide range of statistical tools and is popular in industries such as manufacturing and education.
FAQ
Who is a data analyst?
A data analyst is one who is responsible for collecting, processing, and interpreting data to extract valuable insights that can inform decision-making within an organization.
What are the responsibilities of a data analyst?
The following are the responsibilities of data analysts
– Discussing with clients regarding data analysis requirements
– Collecting and organizing data from various sources
– Cleaning and preprocessing data to ensure its accuracy, completeness, and
consistency.
– Conducting exploratory data analysis using descriptive statistics and data
visualization techniques to identify patterns and trends.
– Selecting and applying appropriate statistical methods or machine learning
algorithms to analyze the data.
– Creating clear and concise reports, dashboards, or visualizations to communicate
the findings to stakeholders.
– Collaborating with cross-functional teams and providing data-driven
recommendations to support strategic decision-making.
What are the skills and requirements of a statistical analyst?
The skills and requirements of a statistical analyst are as follows
– Educational background in mathematics, statistics, and computer science
– Statistical data modeling software knowledge
– Strong analytical, problem-solving, and communication skills.
– Capability to find out data trends
– Knowledge of using data manipulation, statistical analysis, and visualization tools.
– Report writing skills
Conclusion
Statistical analysis is vital in transforming raw data into valuable insights, driving informed decision-making across various domains.
Researchers and professionals can uncover hidden patterns, trends, and relationships within complex datasets by employing appropriate techniques and leveraging powerful software tools.
We hope the article provided comprehensive information on statistical analysis.