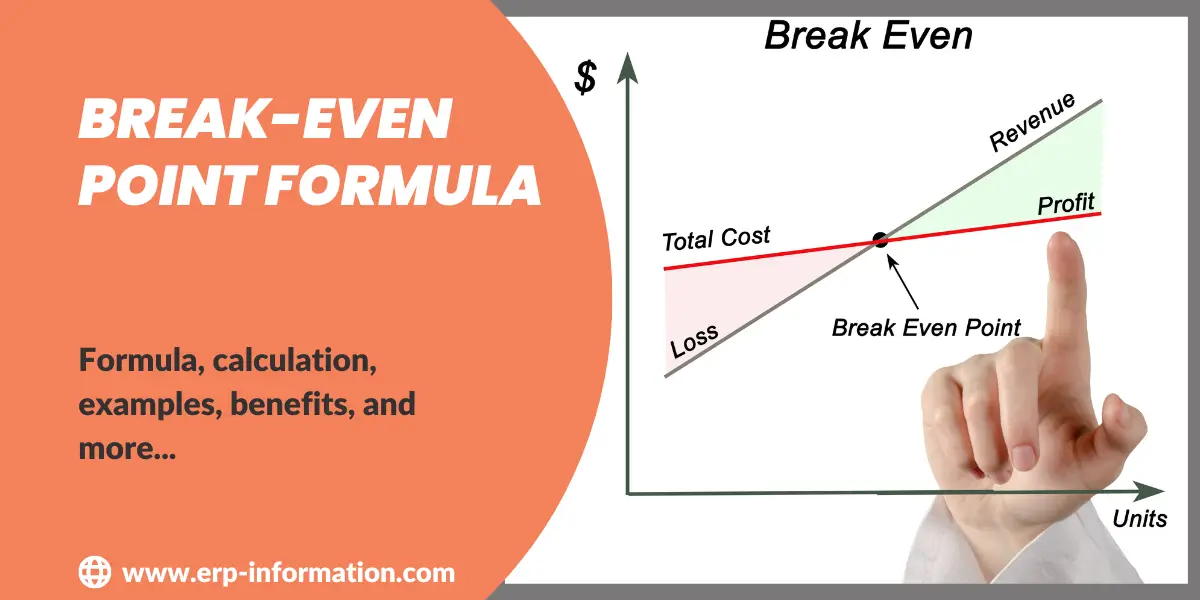
The break-even point is the sales volume at which total revenue exactly equals total cost, so the business records neither a profit nor a loss. In units it is fixed costs divided by the contribution margin per unit, where the contribution margin per unit is the selling price per unit minus the variable cost per unit. Every unit sold past that point adds its contribution margin straight to profit.
This page runs one set of numbers, a $60,000 fixed cost with a $500 selling price and a $350 variable cost, through every version of the calculation: units, sales dollars, the cash break-even point, the volume needed for a target profit, the margin of safety, and a two-product sales mix. Holding the figures constant makes it clear which single input each variant actually changes.
It also covers the case most explanations leave out: what it means when the formula returns a negative number, and why selling more units cannot fix it.
Evaluate the Break-even point using our Online Break-even Point Calculator
What is the break-even point?
The break-even point is a crucial concept in business and finance that refers to the point at which total revenue equals total costs.
It represents the sales or production volume level at which a business neither makes a profit nor a loss. In other words, it is the point where the business breaks even.
To calculate the break-even point, consider fixed costs, variable costs, and the selling price per unit.
Fixed costs are payments that stay the same no matter how many things you make or sell. Examples of this are rent and salaries.
Variable costs, however, change depending on how many things you make or sell. Examples of variable costs are raw materials and labor.
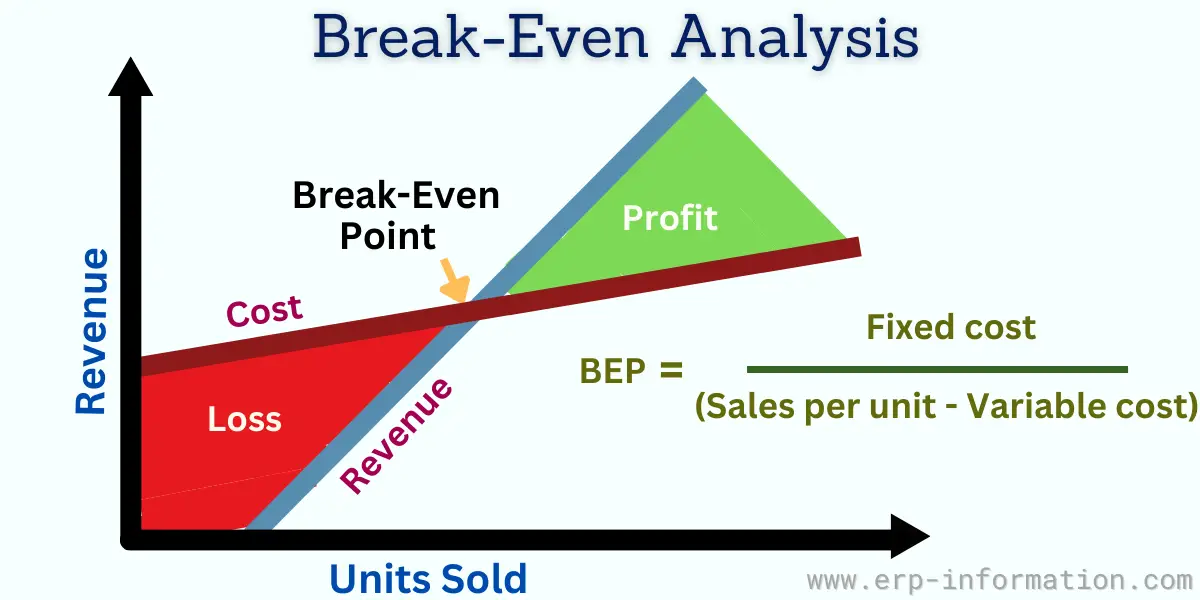
Break-even point formula
The formula to calculate the break-even point in units is
Break-even Point (units) = Fixed Costs ÷ (Sales price per unit – Variable costs per unit)
Knowing the break-even point is important for businesses as it helps determine the minimum level of sales or production required to cover all costs and start generating profit.
It serves as a benchmark for decision-making, pricing strategies, and assessing the financial viability of a business venture.
Examples
Assume your company has fixed costs of $60,000 for the period, sells its product for $500 per unit, and incurs a variable cost of $350 per unit. The calculation runs as below, and every later section on this page reuses these same three figures.
The fixed cost is $60,000
The sales price per unit is $500
The variable cost is $350 per unit
Now apply the formula
Break-even point in units = Fixed Costs ÷ (Sales price per unit – Variable costs per unit)
BEP = $60,000 ÷ ($500 − $350)
BEP = $60,000 ÷ $150
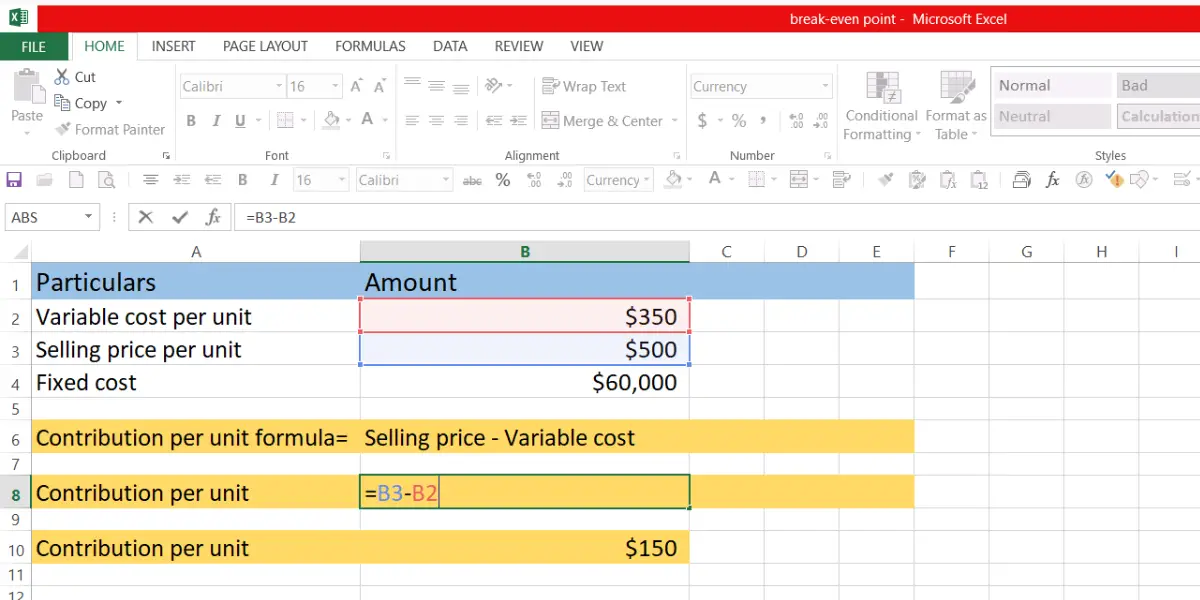
Here, $150 is the contribution per unit cost.
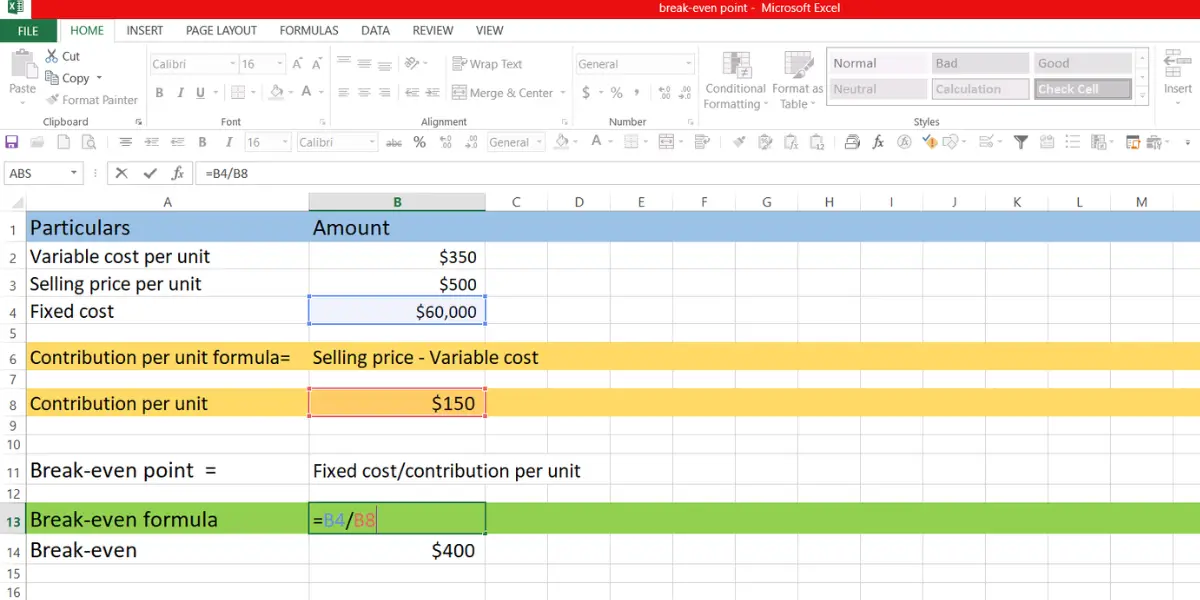
BEP = 400 units
The break-even point is 400 units. Note that 400 is a quantity of units, not an amount of money. At $500 each, those 400 units are what produce the $200,000 sales figure calculated next.
The break-even point in sales value = Fixed Costs ÷ {(Sales price per unit – Variable costs per unit)/ Sales price per unit}
Break-even point in sales value = $60,000 ÷ ($150 ÷ $500)
= $60,000 ÷ 0.30
= $200,000
Both answers describe the same point: 400 units × $500 = $200,000 of sales.
| Line | How it is calculated | Result | Unit |
|---|---|---|---|
| Selling price per unit | given | 500 | dollars per unit |
| Variable cost per unit | given | 350 | dollars per unit |
| Fixed costs for the period | given | 60,000 | dollars |
| Contribution margin per unit | 500 − 350 | 150 | dollars per unit |
| Contribution margin ratio | 150 ÷ 500 | 0.30 | ratio, or 30% |
| Break-even point in units | 60,000 ÷ 150 | 400 | units, not dollars |
| Break-even point in sales | 60,000 ÷ 0.30 | 200,000 | dollars |
Example of a break-even point in the stock market
If you buy a stock for $500, the price must increase to make a profit. If it goes down below $500, you will have a loss. If it stays at $500, there will be no gain or loss – the breakeven point.
Example of breakeven point in call option trading
Options trading has a special point called the breakeven point. If you are buying a call option, the breakeven point is when the asset’s price equals the strike price plus what you paid.
Now, if you are buying a put option, it’s when the asset’s price is equal to the strike price minus what you paid. You will usually not have to pay any more fees, but if you want to include them in your calculations, you can.
An investor buys one call contract at a premium of $5 per share, giving the right to buy 100 shares at a $200 strike. Premiums are quoted per share and a standard contract covers 100 shares, so the contract costs $500. The break-even share price is $205, the strike price plus the per-share premium.
At $220 per share the holder exercises at $200 and sells at $220, a gross $20 per share. Less the $5 premium, that is a net $15 per share, or $1,500 on the 100-share contract.
Example of a break-even point in put option trading
An investor buys one put contract at a premium of $4 per share, giving the right to sell 100 shares at a $280 strike, so the contract costs $400. The break-even share price is $276, the strike price minus the per-share premium. The put only repays its premium if the share price falls below $276.
Break-even point in sales dollars: the contribution margin ratio
The dollar version of the formula divides fixed costs by the contribution margin ratio instead of by the contribution margin per unit. The ratio is the contribution margin per unit divided by the selling price:
Contribution margin ratio = (Selling price per unit − Variable cost per unit) ÷ Selling price per unit
Break-even point (sales dollars) = Fixed costs ÷ Contribution margin ratio
With our figures the ratio is $150 ÷ $500 = 0.30, so break-even sales are $60,000 ÷ 0.30 = $200,000. The U.S. Small Business Administration publishes both forms, and the OpenStax managerial accounting text works the same pair through a single example.
Use the dollar version when there is no single clean selling price, which is the normal case for a restaurant, an agency, or any business with a wide catalogue. A contribution margin ratio can be read straight off the income statement as contribution margin divided by sales, without having to define what one “unit” is.
Cash break-even point
The cash break-even point is the volume that covers the cash costs only. It removes non-cash charges, principally depreciation and amortisation, from fixed costs:
Cash break-even point (units) = (Fixed costs − Non-cash fixed costs) ÷ Contribution margin per unit
Suppose $12,000 of the $60,000 fixed cost is depreciation on equipment that was bought and paid for in an earlier period. That $12,000 is charged against profit but does not leave the bank account this period, so:
Cash break-even = ($60,000 − $12,000) ÷ $150 = 320 units
The business needs 400 units to break even on paper and 320 units to stop draining cash. AccountingTools describes this as the refinement that eliminates non-cash expenses such as depreciation from the numerator.
The gap between the two numbers is what makes this worth calculating. Between 320 and 400 units the product line reports an accounting loss while still generating cash, which is usually an argument for keeping it running in the short term rather than closing it. Below 320 units it consumes cash, which is a more urgent problem and a different decision.
How many units do you need for a target profit?
Break-even is simply the special case where the target profit is zero. To find the volume for any profit, add the target to fixed costs:
Required units = (Fixed costs + Target profit) ÷ Contribution margin per unit
For a $30,000 profit: ($60,000 + $30,000) ÷ $150 = 600 units. Check it the other way round: 600 units × $150 contribution = $90,000, less the $60,000 of fixed costs, leaves exactly $30,000.
Margin of safety: how far sales can fall
The break-even point tells you the threshold. The margin of safety tells you how much room you have above it.
Margin of safety (dollars) = Actual sales − Break-even sales
Margin of safety (%) = Margin of safety in dollars ÷ Actual sales
If the business is actually selling 500 units, actual sales are $250,000 against break-even sales of $200,000:
- In dollars: $250,000 − $200,000 = $50,000
- In units: 500 − 400 = 100 units
- As a percentage: $50,000 ÷ $250,000 = 20%
Sales can fall by a fifth before the business starts losing money. Accountingverse sets out the same three forms.
When the break-even formula returns a negative number
If the variable cost per unit is higher than the selling price, the contribution margin per unit is negative and the formula returns a negative quantity. A negative number of units is not a volume anyone can reach, and it is not a target.
Sell the same product at $300 with a variable cost of $350 and the contribution margin is −$50 per unit:
BEP = $60,000 ÷ (−$50) = −1,200 units
Read that as “there is no break-even point”. Every unit sold widens the loss by $50, so a sales push makes the position worse rather than better. AccountingCoach states the underlying fact plainly: with a negative contribution margin, “if the company increases its sales with the same sales mix, it will experience larger losses”.
The only remedies change the unit economics rather than the volume: raise the price above $350, cut the variable cost below $300, or stop selling the product. Cutting fixed costs will not help here, because fixed costs are not what makes the margin negative.
Break-even when you sell more than one product
The single-product formula assumes one price and one variable cost. With a product mix, use the weighted-average contribution margin per unit, weighted by each product’s share of units sold.
Suppose the same $60,000 of fixed costs supports two products:
| Product | Price | Variable cost | Contribution per unit | Share of units |
|---|---|---|---|---|
| Standard | $500 | $350 | $150 | 70% |
| Premium | $900 | $600 | $300 | 30% |
Weighted-average contribution margin = ($150 × 0.70) + ($300 × 0.30) = $105 + $90 = $195
Break-even = $60,000 ÷ $195 = 308 units once rounded up, which at the stated mix is 216 Standard and 92 Premium. Those quantities contribute (216 × $150) + (92 × $300) = $32,400 + $27,600 = $60,000, exactly covering fixed costs.
The answer holds only while the mix holds. Sell a greater proportion of the lower-margin Standard product and the weighted-average contribution falls, which pushes the break-even point up even though total unit volume looks unchanged. This is the assumption that fails most quietly in practice.
Analysis of breakeven point
A break-even analysis is a calculation that looks at how much money you put in and how much money you get out.
It tells you when the amount of money coming in will equal the amount going out. At that point, you won’t lose any money or make any profit.
What break-even analysis assumes
The formula draws straight lines, and it is only as good as four assumptions. AccountingTools lists them as stable selling prices, stable variable costs, stable fixed costs and a stable sales mix. Each one breaks in a predictable way:
- The selling price is the same at every volume. Volume discounts and promotions break this, so one break-even answer is only valid for one price.
- The variable cost per unit is constant. Bulk purchase discounts, learning effects and overtime premiums all move it.
- Fixed costs stay fixed. Most are fixed only within a relevant range. Renting a second warehouse or adding a shift is a step cost that lifts the whole line at one particular volume.
- The sales mix holds. As the two-product example above shows, the mix can shift while total units look healthy.
None of this makes the calculation useless. It means the break-even point is a reading taken under stated conditions rather than a fixed property of the business, and it should be recalculated whenever a price or a cost changes.
Benefits of breakeven analysis
It surfaces costs you forgot to budget for
A break-even analysis can help estimate how much you have to spend. It can help you know what expenses to expect before they come up. That way, there won’t be any unexpected costs.
Useful to set the goals
A break-even analysis helps you determine how much money you need to make a profit. It will help you set goals and work hard to achieve them.
It replaces gut feel with numbers
It is not usually a good idea to decide things with your emotions. A break-even analysis can help you make decisions based on facts instead of feelings. This is generally better for making business decisions.
Investor funding
When funding for your business, it is essential to provide investors with a break-even analysis. This analysis will outline your business plan and demonstrate how you intend to generate revenue.
Helps to decide the proper price
By utilizing this approach, you can effectively determine the optimal pricing strategy for your products. This will ensure that your business remains profitable and generates a steady stream of revenue.
Helps to assess the impact
This method helps assess the impact of cost changes or increases in production volume on their bottom line.
Moreover, by comparing the break-even point with actual sales, businesses can evaluate their profitability and make informed decisions regarding cost-cutting measures or growth strategies.
The break-even point formula is a simplified calculation and does not consider other factors that may affect business performance, such as market demand, competition, and seasonality.
Therefore, it should be used with other financial and market analysis tools to understand the business’s financial health comprehensively.
FAQs
What are the factors that affect the breakeven point?
The common factors of BEP are an increase in variable cost or expenses, an increase in fixed cost or expenses, a decrease in selling price, and a different mix of products sold can also cause changes in the breakeven point.
How do you lower your break-even point?
Lower the break-even point by changing one of its three inputs. Cutting fixed costs reduces the numerator directly. Raising the selling price or cutting the variable cost per unit raises the contribution margin, which reduces the break-even point faster because it is the divisor. Shifting the sales mix toward higher-margin products has the same effect. One caution on the wording: you do not want to avoid the break-even point, because it is the threshold you need to cross, and below it the business is losing money.
What is the negative breakeven point?
A negative break-even point is what the formula returns when the variable cost per unit is higher than the selling price. The contribution margin per unit is then negative, so fixed costs divided by it produces a negative number of units. Because a negative quantity cannot be produced or sold, the practical meaning is that no sales volume breaks even: every extra unit sold widens the loss. The remedy is to raise the price or cut the variable cost per unit, not to sell more.
What are the limitations of the breakeven point?
Break-even analysis is a straight-line model that assumes stable selling prices, stable variable costs per unit, stable fixed costs and a stable sales mix. Each is an approximation. Volume discounts move the price, bulk buying and overtime move the variable cost, fixed costs are fixed only inside a relevant range and jump in steps when you add a shift or a site, and the sales mix can shift while total unit volume looks steady. The model also ignores when cash actually arrives, so a business can be above its accounting break-even point and still short of cash.
What is the cash break-even point?
The cash break-even point is the sales volume that covers a company’s cash costs only. It equals fixed costs minus non-cash fixed costs, principally depreciation and amortisation, divided by the contribution margin per unit. With $60,000 of fixed costs of which $12,000 is depreciation, and a contribution margin of $150 per unit, the cash break-even point is $48,000 divided by $150, or 320 units, against an accounting break-even point of 400 units.
Conclusion
The break-even point is one division: fixed costs over the contribution margin per unit. Everything else on this page is that same division with one input changed. Strip depreciation out of fixed costs and you get the cash break-even point. Add a target profit to fixed costs and you get the volume that earns it. Divide by the contribution margin ratio instead of the per-unit margin and the answer arrives in dollars rather than units.
Two things are worth carrying away. First, the units matter: 400 units and $200,000 of sales are the same point described two ways, and a spreadsheet formatted as currency will happily show the unit answer as “$400”. Second, if the formula hands back a negative number, it is not telling you about a small break-even point. It is telling you that you are losing money on every sale and that volume cannot rescue it.
Businesses can make informed decisions about pricing, cost management, and profitability by calculating the break-even point, which represents the level of sales at which total costs are equal to total revenue.
Businesses can gain valuable insights into their cost structure, pricing strategies, and overall profitability by utilizing the break-even point formula as part of their financial analysis toolkit.
It empowers them to make data-driven decisions and confidently navigate the business landscape’s complexities.
Using Google Search? Add erp-information.com as a preferred source.