Even though you know about detailed financial reporting processes that have largely gotten into practice in many countries, you may not have fully realized their potential. Yet, financial analysis is an essential part of modern business.
Ultimately, the new tool helps companies stay compliant and streamline revenues and expenditures across their entire portfolio.
Using financial data in a web analysis helps internally collect valuable information and leverage data and insights to improve the areas where business operations can flow significantly.
This article informs you about financial reporting and analysis’s importance, purpose, main objectives, benefits, users, and types of financial reporting.
What is financial reporting and analysis?
Financial reporting and analysis refer to the process of preparing, presenting, and interpreting financial information to stakeholders such as investors, creditors, and management and businesses. Stakeholders or businesses use this information to make informed decisions and comply with tax regulations.
Financial reporting involves preparing and presenting financial statements such as the income statement, balance sheet, revenue statement, expenses, and cash flow statement. These statements provide a comprehensive view of a company’s financial performance.
Financial analysis involves using financial data to evaluate a company’s performance and make informed decisions.
That can include analyzing revenue growth or profitability trends, assessing liquidity and solvency ratios to determine a company’s capacity to meet its financial obligations, or comparing its performance with its competitors.
Purpose of finance reporting and analysis
Financial reporting and analysis provide stakeholders with relevant information that enables them to make informed decisions about investing in or lending money to a company.
That includes generating reports summarizing the organization’s financial results and analyzing those results to determine trends, patterns, and areas for improvement.
Financial reporting and analysis also help managers assess their performance and identify areas for improvement.

The main objectives of the finance report and analysis are
To manage the financial health of an organization
Finance reporting and analysis help stakeholders track the organization’s performance over time and identify any changes or trends that may be cause for concern.
To make informed decisions
By collecting and analyzing real-time data, stakeholders can make informed decisions about allocating resources, investing in new projects, or adjusting their operations to improve profitability.
To comply with regulatory requirements
Many organizations are legally required to prepare and submit financial reports to government agencies or other regulatory bodies.
To attract investors
Investors often use financial reports to evaluate the strength and stability of a company before deciding whether to invest.
To communicate with stakeholders
Financial reports allow organizations to communicate important information about their finances to shareholders, employees, customers, and suppliers.
Why is financial reporting important?
In the latest report, McKinsey argues that using data to create more accurate marketing information can increase sales and marketing effectiveness by 15-20%.
When we take the same logic to finance departments, it’s clear these reports can be of great value and give your business a better overview of your operations. Financial statements give insight into your business finances.
Communicates essential data
Key shareholders, executive investors, and professional users rely on the latest financial data for decision-making, budgeting, and performance monitoring.
Open communication and transparency are crucial to support funding, investments, and financial reviews. Most investors rely on company information to evaluate profitability, risk and return.
Supports financial analysis and decision-making
Financial reporting is important in the process of analyzing the results and supporting decisions. Utilizing financial statements increases accountability and helps in analyzing important financial data.
Documents such as the earnings statement are easy to track your financial position and make accurate forecasts.
Compliance and law
Financial reporting has a major impact despite meeting only some regulatory requirements. Most corporations involve some stakeholders that require periodic financial reports to be filed. In private companies, it’s the SEC.
Private company loans may require periodic reports of debt covenants. The Internal Revenue Service mandates that all U.S. businesses report on their financial statements to meet the requirements.
For raising capital and performing audits
Financial reporting can help to raise more money and manage it more efficiently. Reporting financial information ensures continued commercial success in a competitive digital world and helps companies raise local and overseas capital.
In addition, a detailed audit of the finances helps facilitate the statutory audit. Statutory auditors must audit a company’s financial statements to determine its opinion.
For improved internal vision
Analyses are an effective way to communicate critical financial data across an organization. However, when financial insights and information are scattered, everything will quickly crumble.
Financial analysis and reports help answer your company’s key financial questions and provide internal and external users with a detailed overview and analysis. In addition, the metrics needed in a business decision-making process are also provided.
6 Common types of financial reporting
There are many financial reports. Here we listed common types of financial reporting.
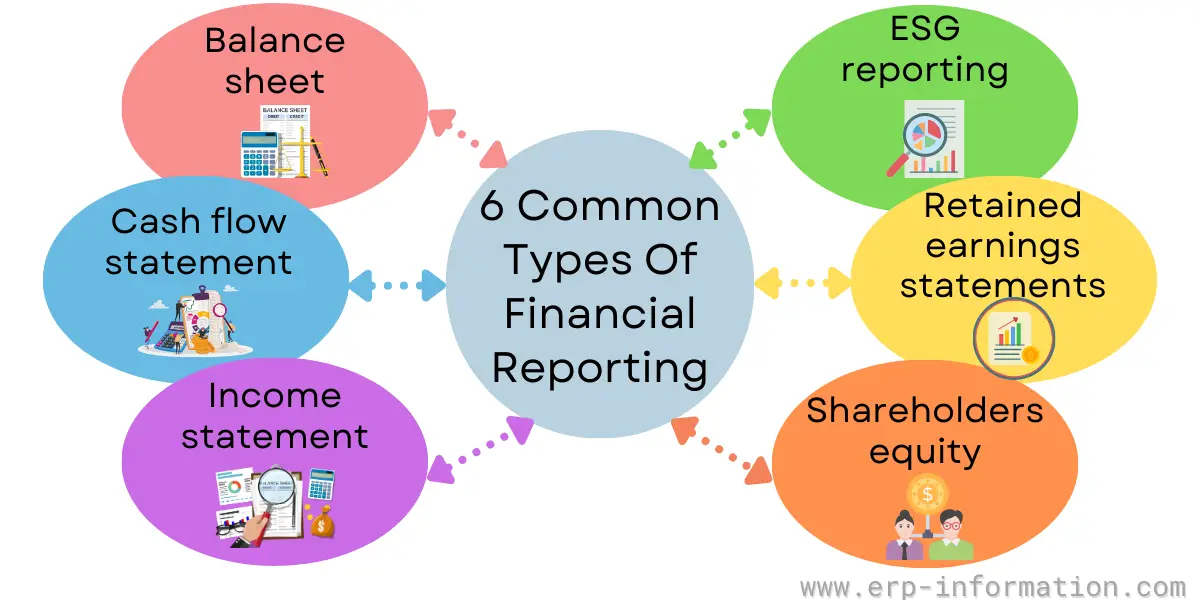
1. Balance Sheet
A balance sheet is a financial statement that gives a snapshot of an organization’s financial position at a specific time. The balance sheet shows the organization’s assets, liabilities, and equity.
Assets represent the company’s resources that have economic value and can be used to generate future revenue. Examples of assets include cash, accounts receivable, inventory, property, plant and equipment, and investments.
Liabilities represent the company’s obligations to pay debts or other financial obligations. Examples of liabilities include accounts payable, loans payable, accrued expenses, and deferred revenue.
Equity speaks for the residual interest in the company’s assets after all liabilities are paid off. Equity includes common stock, retained earnings (profits earned but not distributed to shareholders), and other comprehensive income.
2. Cash Flow Statement
It displays your total revenue and expenses from the business over the past year. The cash flow statement helps you track how much you can afford your employees.
This highly interactive and visually appealing template provides all the necessary information to understand your business’s liquidity and financial position. In addition, this quick ratio demonstrates red exclamations, which suggest your company can’t cover current liabilities with the most liquid assets.
3. Income statement
An income statement, a profit and loss or P&L statement, is one of the financial statements used to report a company’s financial performance over a specific period. The income statement provides a company’s revenues, expenses, gains, and losses during the reporting period.
This report aims to confirm whether the business is making a profit. The report considers and subtracts production and other process costs from revenue to calculate profit.
4. Shareholders’ equity
A shareholder’s equity statement, also known as a statement of changes in equity, is a financial statement showing changes in a company’s equity over a specific period. Shareholder’s equity represents the residual interest in the company’s assets after all liabilities are paid off.
A shareholder’s equity statement provides information about how a company’s equity has changed over time and what factors have contributed to those changes. Investors can use it to assess a company’s financial performance and make investment decisions.
The shareholder’s equity statement typically includes Beginning Equity, Net Income, Issuance of Stock, Dividends Paid, and Ending Equity.
5. Retained earnings statements
A statement of retained earnings shows the changes in a company’s retained earnings over a specific period.
It represents the portion of a company’s net income that the company keeps instead of being distributed as dividends to shareholders. Net income, beginning retained earnings, Dividends Paid, Other Adjustments, and Ending Retained Earnings.
The purpose of a retained earnings statement is to provide information about how a company has used its profits over time.
For example, investors can use it to assess whether a company is reinvesting profits back into its business or distributing them as dividends to shareholders. It can also indicate a company’s financial health and stability.
6. ESG reporting
ESG reporting involves disclosing a company’s environmental, social, and governance (ESG) performance to stakeholders. ESG factors are used to evaluate a company’s sustainability and ethical impact on society and the environment.
ESG reporting aims to inform investors and other stakeholders about a company’s non-financial performance to make informed decisions.
ESG reporting can also help companies identify areas to improve their sustainability practices and enhance their reputation as socially responsible businesses.
ESG reporting typically includes information on a range of topics such as climate change, energy efficiency, labor practices, human rights, diversity and inclusion, executive compensation, board composition and structure, anti-corruption policies, supply chain management, community engagement, and other issues that affect a company’s social and ecological footprint.
There are many standards for ESG reporting. However, there are several frameworks that companies can use to guide their disclosures.
Financial statistics cannot be understood, and the Excel sheet’s complexity makes the extraction even harder. In this sense, Interactive Financial Reporting Software was designed to assist businesses in obtaining accurate financial information.
In addition, automated dashboard technology allows business users to gain real-time information about their financial situation for better decision-making. We already discussed many typical financial reports in this article.
The following are the visual representations of those reports.
Financial KPI dashboard
A robust financial dashboard with detailed KPIs is designed to maintain financial health. This dynamic financial reporting system provides tools to reduce inefficiencies and forecast accuracy while efficiently ensuring cash flows through the organization.
CFO dashboard
It can also be called the ‘CFO cockpit’ and provides an easily accessible view of key economic metrics. Here is what you need as a Senior Decision Maker to understand workplace trends and make informed business decisions.
Accurate vs forecast dashboard
An accurate vs forecast dashboard is a tool used to monitor and compare actual performance against forecasted performance.
The dashboard typically displays key metrics and KPIs (Key Performance Indicators) in an easy-to-read format, allowing users to identify discrepancies between actual results and forecasts quickly.
In addition, the dashboard provides insights into revenue, costs, and net profits. Finally, it aims to provide accurate information about the organization’s performance by comparing actual results against forecasts. As a result, knowing this organization can improve areas where they are underperforming.
Benefits of financial reporting
We will examine how financial reporting is beneficial to businesses.
Builds strategies and ensures profitability
Financial analysis and reporting are crucial for creating a successful strategy to maintain profitability for the business. According to a Deloitte survey, 75% of the respondents said using financial statements is key to finding effective strategies to reduce costs. However, this kind of report becomes crucial for determining financial strength.
Manages financial ratios
The ratio is critical to any business’ finances and must be considered. The ratio is an example of the fine jiggling act the business must carry out to ensure the operation runs efficiently.
The financial ratio helps companies understand and analyze the colossal financial data they are getting. A ratio provides data form and direction, enabling accurate comparisons between reporting periods. Visualize today’s financial graphs, and dashboards provide invaluable performance information in one click.
Identifies trends
The financial reports help to identify current trends, which helps organizations to identify weak areas. In this way, they enhance the overall growth of the business.
Enhances working capital management
Real-Time Financial Reporting assists managers in planning and managing current assets and achieving current obligations without causing underutilization, overdrafts, and loss. The government is also responsible for managing unsecured debts, primarily revolving credit accounts and other short-term lending instruments such as credit cards.
Manages liabilities
Liability management is a crucial part of the financial health of the business. Credit cards, credit lines, Business loans, and credit extended from clients are manageable liabilities.
Before submitting a business expansion loan application, utilizing financial report templates can help you assess and evaluate your finances, identify any existing liabilities that need to be reduced, and ultimately determine how viable the request will be.
Enhances cash flow
Cash flow is very important for businesses financial health. With the help of key performance indicators (KPIs), businesses can easily analyze cash flow to predict profits and losses.
Who uses financial reporting and analysis?
A wide range of stakeholders uses financial reporting and analysis in an organization, including:
- Management: The management team uses financial reporting and analysis to make strategic decisions, monitor performance, and identify areas for improvement.
- Investors: Investors use financial reporting and analysis to evaluate a company’s financial health and stability before making investment decisions.
- Lenders: Lenders use financial reporting and analysis to determine a company’s creditworthiness before granting loans or lines of credit.
- Regulatory institutions: Regulators use financial reporting and analysis to ensure companies comply with relevant laws, regulations, and accounting standards.
- Employees: Employees may use financial reporting and analysis to understand the company’s financial performance and how their roles contribute to overall success.
- Customers: Customers may also be interested in a company’s financial performance as it can impact their perception of the brand’s stability and trustworthiness.
Financial reporting and analysis is a critical component of business operations that helps stakeholders make informed decisions based on accurate data about the organization’s finances.
FAQs
What are the three types of financial analysis?
There are three main types of financial analysis:
Horizontal Analysis: This type of financial analysis compares an organization’s financial performance over multiple periods by analyzing changes in its financial statements. It involves comparing line items on financial statements from one period to another, such as revenue figures from the current year to the previous year.
Vertical Analysis: Vertical analysis compares different line items on a single financial statement to each other, expressed as a percentage of a selected base figure.
Ratio Analysis: Ratio analysis involves using ratios and metrics to analyze an organization’s financial performance and operational efficiency.
What are the four types of financial ratio analysis?
The four types of financial ratio analysis are:
Liquidity Ratios: Liquidity ratios measure a company’s ability to meet its short-term obligations. Investors can get an idea of the operational efficiency of the company. Examples are the current ratio, quick ratio, and cash ratio.
Profitability Ratios: Profitability ratios measure a company’s profit relative to its revenue, assets, or equity. Examples of profitability ratios include gross margin, net profit margin, return on assets (ROA), and return on equity (ROE).
Solvency Ratios: Solvency ratios measure a company’s ability to meet its long-term obligations. These ratios include the debt-to-equity ratio, debt-to-total-assets ratio, and interest coverage ratio.
Valuation Ratios: Valuation ratios are used to analyze the attractiveness of investment in an organization. Examples of valuation ratios include price-to-earnings, price-to-book, and price-to-sale.
Conclusion
In conclusion, financial reporting and analysis is an indispensable way of obtaining, understanding, and utilizing a company’s financial information. It offers incredible insights into the condition of a company, helping investors and stakeholders make more informed decisions.
In addition, financial reporting is essential in calculating certain business characteristics, such as profitability ratios, liabilities to capital ratios, and growth performance.
This post covered the definition, importance, objectives, types, and benefits of financial reporting and analysis. We hope it is a useful guide for you.
Reference