Process flow diagrams are essential to represent a process and its steps visually. They enable organizations to plan, understand, and analyze their operations more effectively.
A well-designed process flow diagram can make complex processes easier to comprehend and illustrate how different elements work together to achieve a given goal. In addition, by clearly depicting the workflow, these diagrams help identify potential issues and bottlenecks hindering performance.
This blog post will explain the process flow diagram, its uses, workflow, how to plan, and types.
What is a Process Flow Diagram (PFD)?
A process flow diagram is a diagrammatical presentation of plant processes and equipment. A PFD is a vital chemical and process engineering tool mapping out the relationships between major equipment in a plant facility.
Finally, an intuitive ‘flowsheet’ gives an overview of how components are connected to create desired processes – without getting bogged down with small details like piping or designations.
History
In the early 1920s, Frank Gilbreth started revolutionizing efficiency and productivity in industries ranging from manufacturing to business. His “flow process chart” marked a breakthrough for managing processes – quickly becoming embraced by ASME and industrial engineering, production systems, and, more recently, information processing.
By tracking movement between stages of workflows across various disciplines via diagrams like data flow charts or business models, this system has spawned incredible innovations over the last century!
How and where can it be used?
- PFD is an effective communication process
- A complete list of operations will be depicted in the diagrams
- Level details will be studied and decided by the teams
- It includes more information and less probability of missing failure modes
- It has more details for a critical presentation
- Industrial engineers should produce the PFD
- First, log the major work process, add the detailed task, and include rework and repair steps.
- Manufacturing engineers and technicians use verb-object construct to describe the process.
Types of Flow Diagrams and Instrumentation
Flow diagrams are normally planned and depicted by process engineers, and many large-scale engineering companies will have a separate department to develop flow diagrams. Various presentation types are used for flow diagrams, and we can consider process diagrams, mechanical diagrams, and Utility flow diagrams.
How Does Process Flow Diagram Work?
A process flow diagram is the first process diagram developed during the design process. It provides a visual overview of the chain of events that must take place to achieve the desired outcome.
A process flow diagram is a simple graphical representation, and this diagram can evolve into an intricate network of interrelated operations and processes stretching across multiple departments, systems, or continents. It is effective for designing complex processes and discovering hidden problems or areas of inefficiency. Every process chart will have starting and endpoint. It may have more than one ending point.
This includes
- Important technical equipment
- Main piping
- Flow direction
- Mejor controlling tools
- Operation process of facility components
- Control valves and critical process valves
- Process team names
Process diagram highlights
- Certain conditions must be met when designing different pieces of equipment, like fractionation columns, pumps, and heaters, that will be used in the facility.
- The conditions that a particular piece of equipment will work in. Design conditions tell us how much pressure and temperature the parts of the equipment can handle. Design pressure is calculated at least 10% above the maximum operating pressure or 25# greater (whichever is the largest). The design temperature will be at least the maximum operating temperature but should be at least 25 degrees above the normal operating temperature.
- The refining or treatment process uses different materials. Some materials are added, and some are taken away.
Types
Below are the process flow diagram examples.
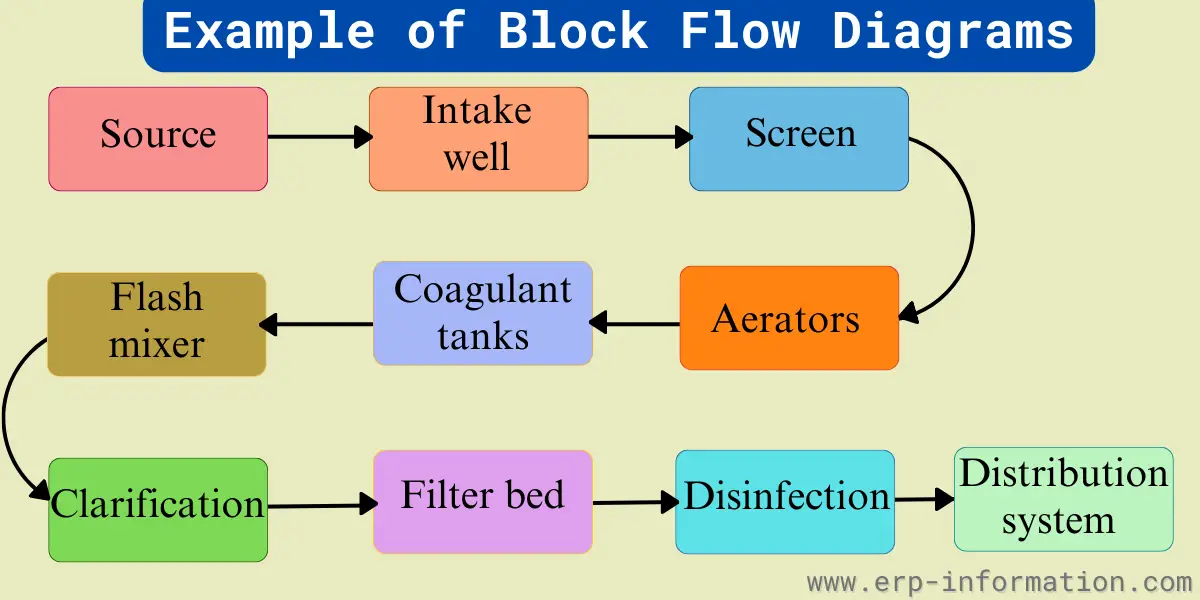
Block flow diagrams
In Block flow diagrams, blocks can show a piece of equipment or a step in a process. A rectangle shows a piece of equipment, and labels illustrate function. The process flow is shown from left to right, and directional arrows indicate the flow direction.
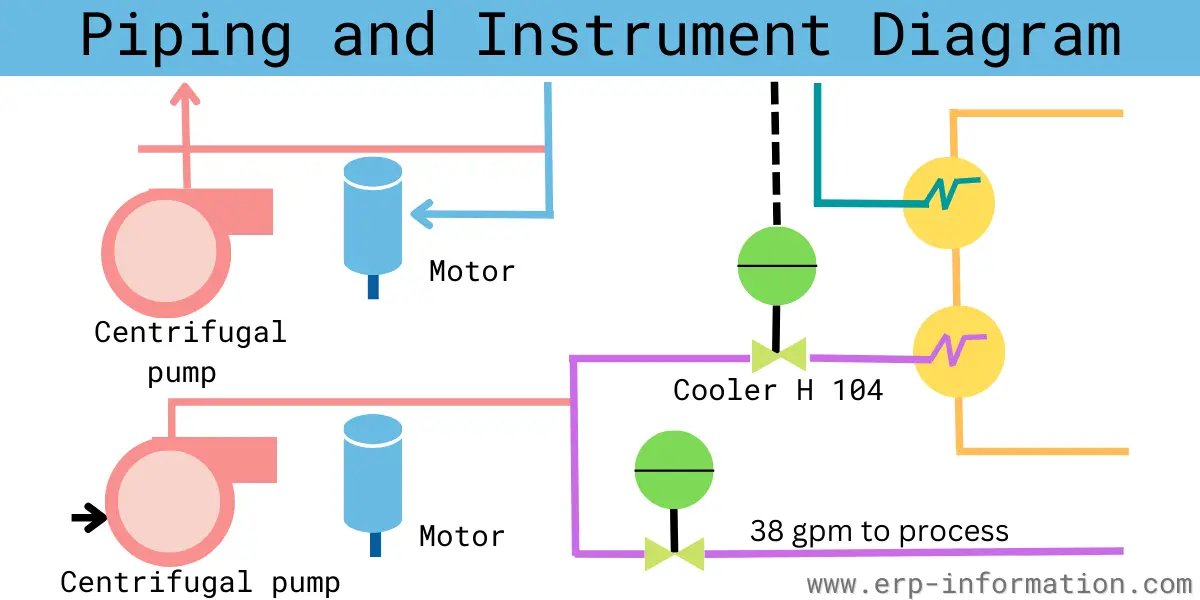
Piping and instrument diagram
A piping and instrument diagram is a technical drawing showing the details of a system’s piping and instruments. For example, it shows the equipment, process sequence, process, utility piping, bypass lines, instruments, valves, vents, drains, and other items. Different shapes have different indications.
How to Plan a Process Flow Chart?
The following are the steps that help you to plan a better process flow chart.
- Define What do you want to study? What do you like to learn?
- It would help if you decided how much detail to include. If you want a more sophisticated process, you should create different versions of the diagram for other groups of people.
- Consider forming a project team or using quality control and consultants to ensure maximum accuracy for advanced projects. For simpler tasks, you can research yourself for more independent results!
- For a complex process like the kind you might find at an industrial plant, the research is usually done by a project team, quality control group, or consultant. But for a simpler process, you can research using something as basic as sticky notes.
- Draw a diagram of the process and show it to the involved people. Then, work together to make any changes, additions, or deletions needed.
- Finally, the diagrams can be used for documentation, quality assurance, improvement, or other goals.
Tips for Designing Process Flow Diagrams
- Capture the information on a sheet of paper
- Use intuitive software to design the diagram.
- Select the diagram software that can easily highlight the missing operational data.
- Concentrate on the audience and Be consistent with the standardized symbols you use for the diagram so there won’t be any confusion.
- Use standard symbols such as ISO 10628 on a PFD to communicate with other companies or agencies.
Advantages and disadvantages of the process flow
Advantages
- It enables easy and better communication.
- Helpful for the visualization of complicated procedures in a simplified manner.
- It helps to analyze the way of cost saving and time allocation.
- It helps to Analyze the way to improvement.
- This documentation of the process is useful for showing how processes work.
- Useful for eliminating the not required processes.
Disadvantages
- Flowcharts can be difficult when changes need to be made. It takes a lot of time and money to redraw the whole flowchart. This is the biggest downside of using flowcharts.
- When a process is complicated, it can be hard for the people in charge to understand. It might take too much time to figure out what is happening.
- Flowcharts do not allow you to type symbols. You must use other software like Word or Excel to make shapes and put words in them. This makes it hard to copy a flowchart since you need shapes.
What are the main symbols used in flowcharts?
Flowchart symbols are used to show a process or an algorithm. The basic shapes for these symbols are oval, rectangle, diamond, parallelogram, and arrow.
What is the basic purpose of the diagrammatical presentation?
A process diagram is used to show how a process works. It shows the different steps in the process. Process diagrams help teams talk and work together better, find things that need to be improved, and track how far along they are.
How detailed should a flow chart be?
When making a flowchart, include enough information. It should be detailed enough to understand the process and do any needed analysis. You may need both a high-level map and a more detailed one.
Conclusion
A process flow diagram is an effective way to visualize the steps of a process to identify any potential flaws or areas for improvement. It can also be used to measure efficiency and track progress over time. In addition, users can effectively manage their processes by following the steps outlined in the flow chart.
We hope this blog post has provided you with the complete details of the process flow diagrams, their uses, work, types, and many more.