The Production Possibility Curve, or PPC, is a fundamental economic concept that helps us understand an economy’s choices in allocating resources effectively.
It shows the maximum amount of one good that can be produced if all resources are used to produce the other good. It also illustrates how expanding the production of one good necessarily means producing less of the other good.
This article will discuss the Production Possibility Curve in more detail, including its importance, examples, and limitations.
What is the production possibility curve?
The production possibility curve graphically represents the fusion of two goods that an economy can produce using all its available resources. The curve illustrates the concepts of scarcity, choice, opportunity cost, and efficiency.
Details
The Production Possibilities Curve, also known as Production Possibilities Frontier (PPF), is an economic model that illustrates the concept of opportunity cost.
It helps demonstrate the trade-offs that an economy must make when deciding how to allocate resources among various goods and services.
By showing the maximum amount of one good that could be produced with limited resources without affecting the production of another good, the production possibilities curve demonstrates that an economy cannot produce everything it wants.
How is the production possibilities curve drawn?
This is created by plotting two goods on each axis and showing all combinations of those goods that can be produced using all available resources efficiently on a graph.
The efficient points are represented as a curve with an inward slope because producing more of one good requires sacrificing some production of another good.
Points along this curve show different attainable product combinations given existing resources and technology.
Points inside the curve indicate an economy’s current level of inefficiency, meaning it needs to produce at its full potential.
The curve shows the maximum possible amount of one good that could be produced, given a certain production level for the other.
The concept of opportunity cost can explain this: if more resources are devoted to producing one good, fewer will be available for producing another good; in other words, it would not be possible to have an infinite supply of both goods.
To illustrate production possibilities more effectively, economists often draw production possibility curves for different economic scenarios, such as when there is technological advancement, when resources become more available, or when there is a growth in the number of people employed.
By comparing these curves from different economic scenarios, it is possible to show how changes in resource availability, technology, and other factors can affect production possibilities.
Importance
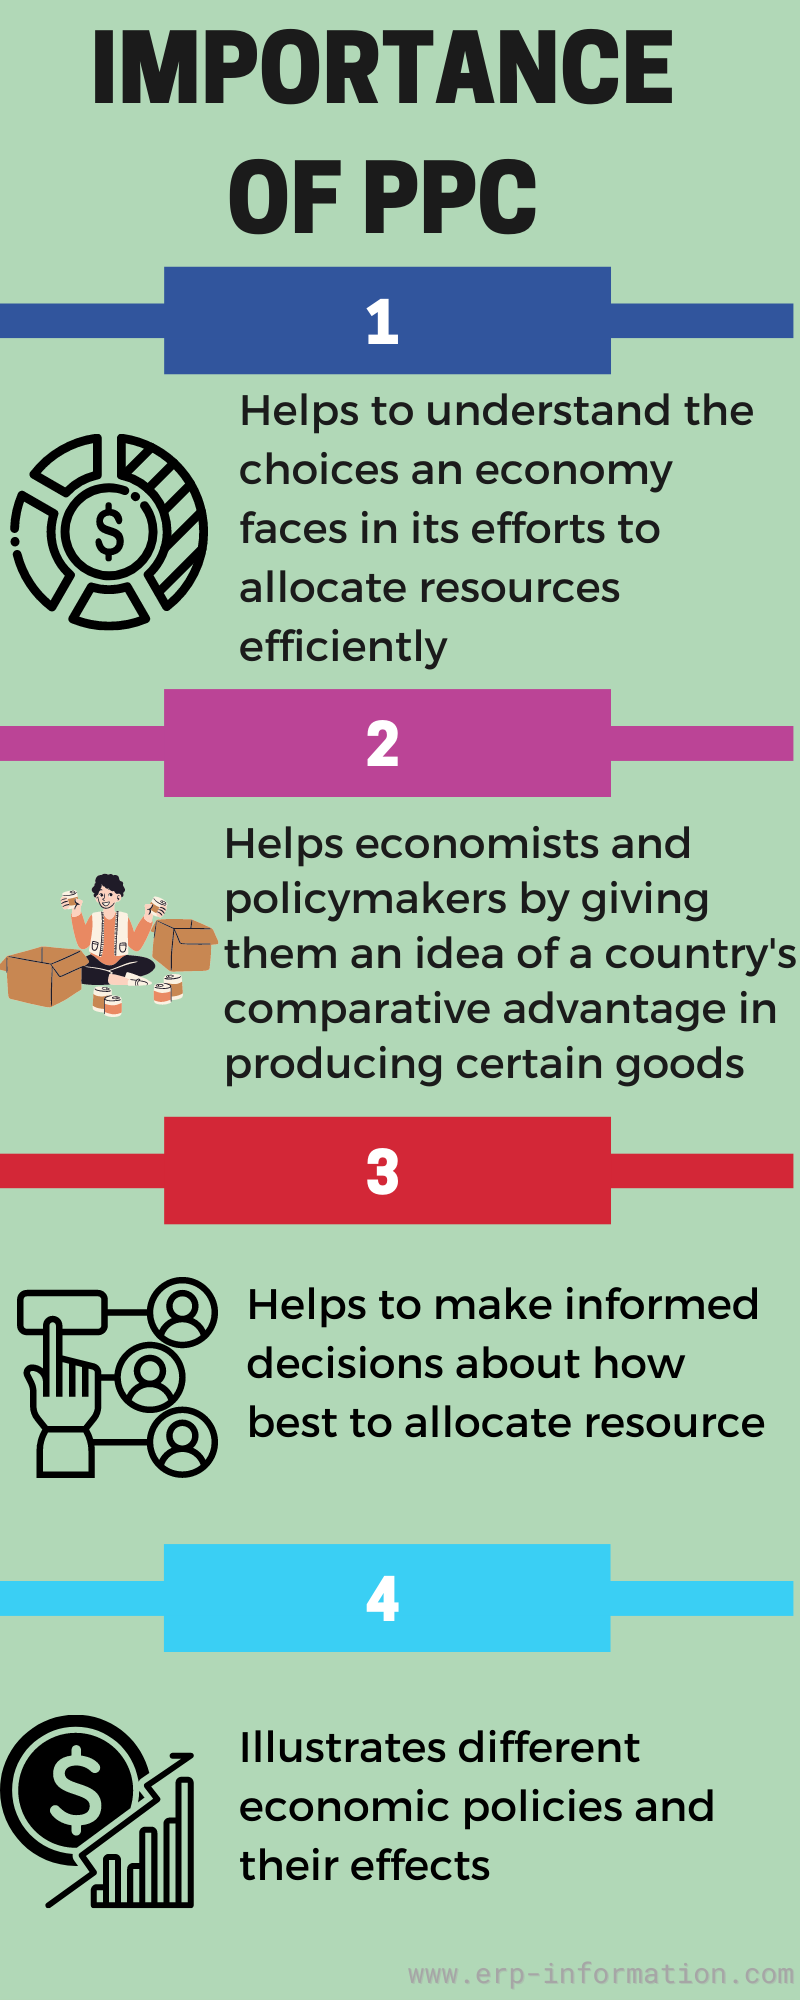
It is an important concept in economics that helps us understand the choices an economy faces in allocating resources efficiently.
It can help economists and policymakers by giving them an idea of a country’s comparative advantage in producing certain goods.
This can be used to inform decisions about how best to allocate resources as well as investments that will lead to economic growth.
The curve can also illustrate different economic policies and their effects. For example, a government might invest in education and healthcare, creating more efficient production possibilities for the entire economy.
Production possibilities frontier example
Here we illustrate PPC for a country’s economy with a simple example.
Let us assume that Toys (T) and calculators (C) are commodities a county produces, as shown in the diagram.
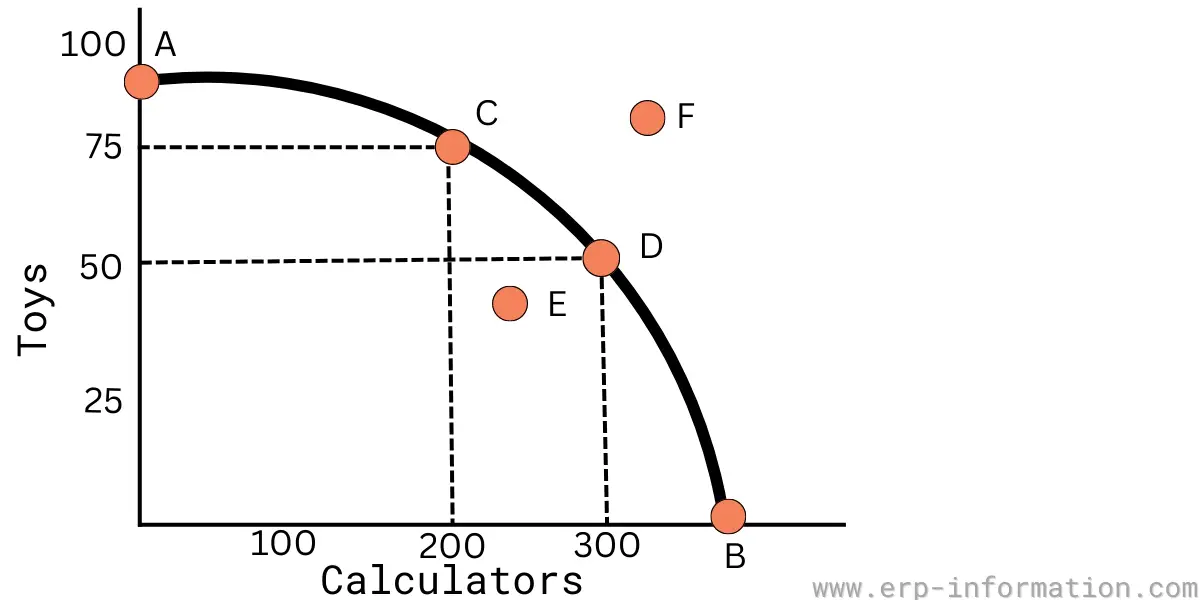
- A shows the production level of toys.
- B indicates the production level of calculators.
- C is one possible combination of toys and calculators’ production levels.
- D is one more combination of these production levels.
- E shows inefficient use of resources, which means unemployed resources.
- F represents an unachievable level of production based on current resources.
The four assumptions of a production possibilities curve
Four key assumptions were made as follows:
1st assumption – Constant technology
It assumes that the technology used to produce a good or service remains the same and does not improve over time.
2nd assumption – Fixed resources
Production Possibilities Curves assume that all resources available remain unchanged and cannot be increased or decreased with more investment.
3rd assumption – Full employment of resources
Production Possibilities Curves assume that all resources available are fully employed and none are left idle.
4th assumption – Only two goods
Production Possibilities Curves assume that only two goods or services represent the whole market.
These assumptions allow economists to predict how production possibilities will change in different scenarios.
The four factors that shift the production possibilities curve
It can be shifted by four major factors: changes in technology, changes in resources, changes in prices, and changes in preferences.
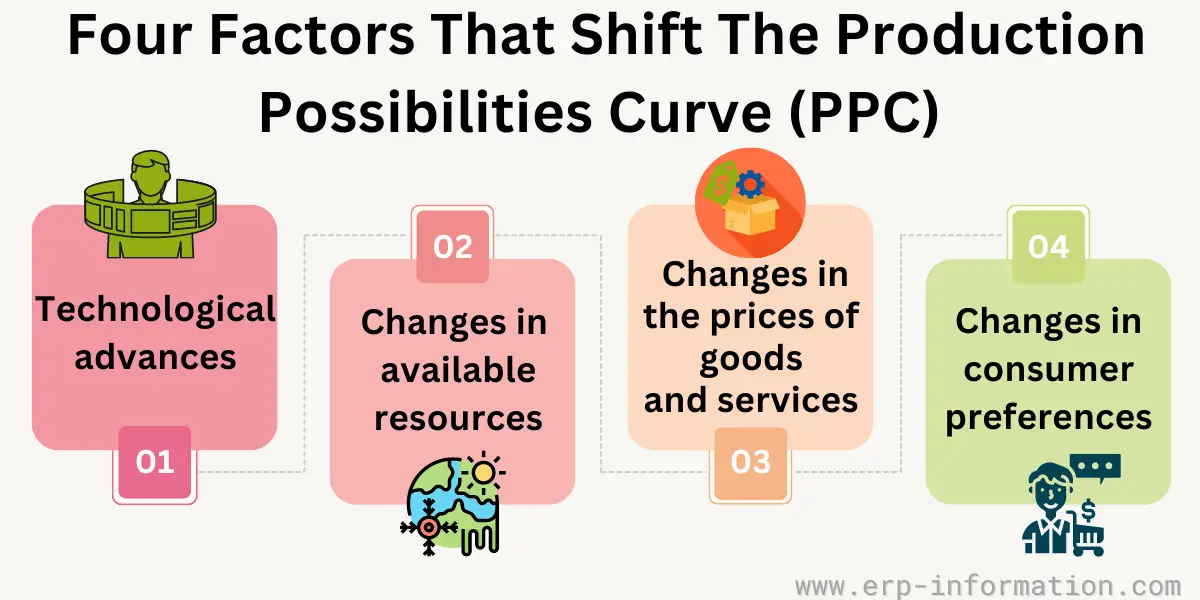
First, technological advances can lead to an outward shift of the PPC, enabling producers to produce more with the same resources.
Second, changes in available resources influence how much good producers can make and consequently shift the production possibilities curve. An increase in resource availability will cause the curve to move outwards, while a decrease in resource availability will cause it to move inwards.
Third, changes in the prices of goods and services can cause the curve to shift. For example, if the price of a good increases, producers’ incentive to produce that good will decrease and shift the curve inwards.
Finally, changes in consumer preferences can also affect the PPF. As consumers’ wants change over time, the PPF shifts to adjust for those changes. For instance, if consumers prefer one good over another, production of that preferred good will increase and cause the curve to move outwards.
Limitations
It is based on the assumption that all inputs are used efficiently
The curve assumes that all inputs and resources are used efficiently, which may only sometimes be the case.
It cannot consider factors such as technological advances
The curve does not consider factors such as technological advancements or changes in preferences.
They do not account for opportunity costs.
They do not account for the opportunity costs associated with a decision, such as lost production in one sector while producing more of another.
They cannot consider external factors.
Curves do not consider external factors that may affect the production output, such as taxes or subsidies.
They are static and do not account for changes in demand over time
Production possibilities curves are static and do not account for changes in demand over time. This can lead to inaccurate predictions of production outcomes.
They do not consider the impact of trade restrictions
The curves do not consider any restrictions that may be imposed on the trade of goods, such as tariffs or quotas. That can have a significant impact on production possibilities in certain industries.
FAQs
Can the PPC shift over time?
Yes, the PPC can shift due to factors like technological advancements, changes in resource availability, improvements in productivity, or economic policies
How is the PPC constructed?
The PPC is constructed by plotting various combinations of two goods or services on a graph, showing the trade-offs between producing one good versus the other.
Conclusion
The production possibility curve demonstrates how investments in one good or service may decrease the production of another. Understanding how Production Possibilities Curves work can help individuals and businesses make more informed decisions about their resources and investments.