
The target inventory level is the order-up-to point in a periodic review system: the inventory position you raise an item to at each review, counting stock on hand plus stock on order, minus backorders. It equals expected demand over the review period plus the lead time, plus safety stock.
At every review you order the target minus the current inventory position, so the order size changes with demand while the target stays fixed. In a min-max system the same number is called the maximum.
What this page adds: a worked example that nets stock already on order; the target, peak and average stock shown apart; how the review period moves the target; safety stock formulas with a Z table; and the ERP settings, checked on 11 October 2026.
Assess your target inventory with our Target Inventory Level Calculator
What is the Target Inventory level?
The ANSI Z94 terminology for operations and inventory planning, published by IISE, describes the min-max system this way: the minimum is the order point, the maximum is the order-up-to inventory level, and the order quantity is the maximum minus the stock available and on order. MIT’s logistics course notes give the periodic version, the (R, S) policy: every review period R, order S minus the inventory position, where inventory position is stock on hand plus stock on order, minus backorders and committed stock.
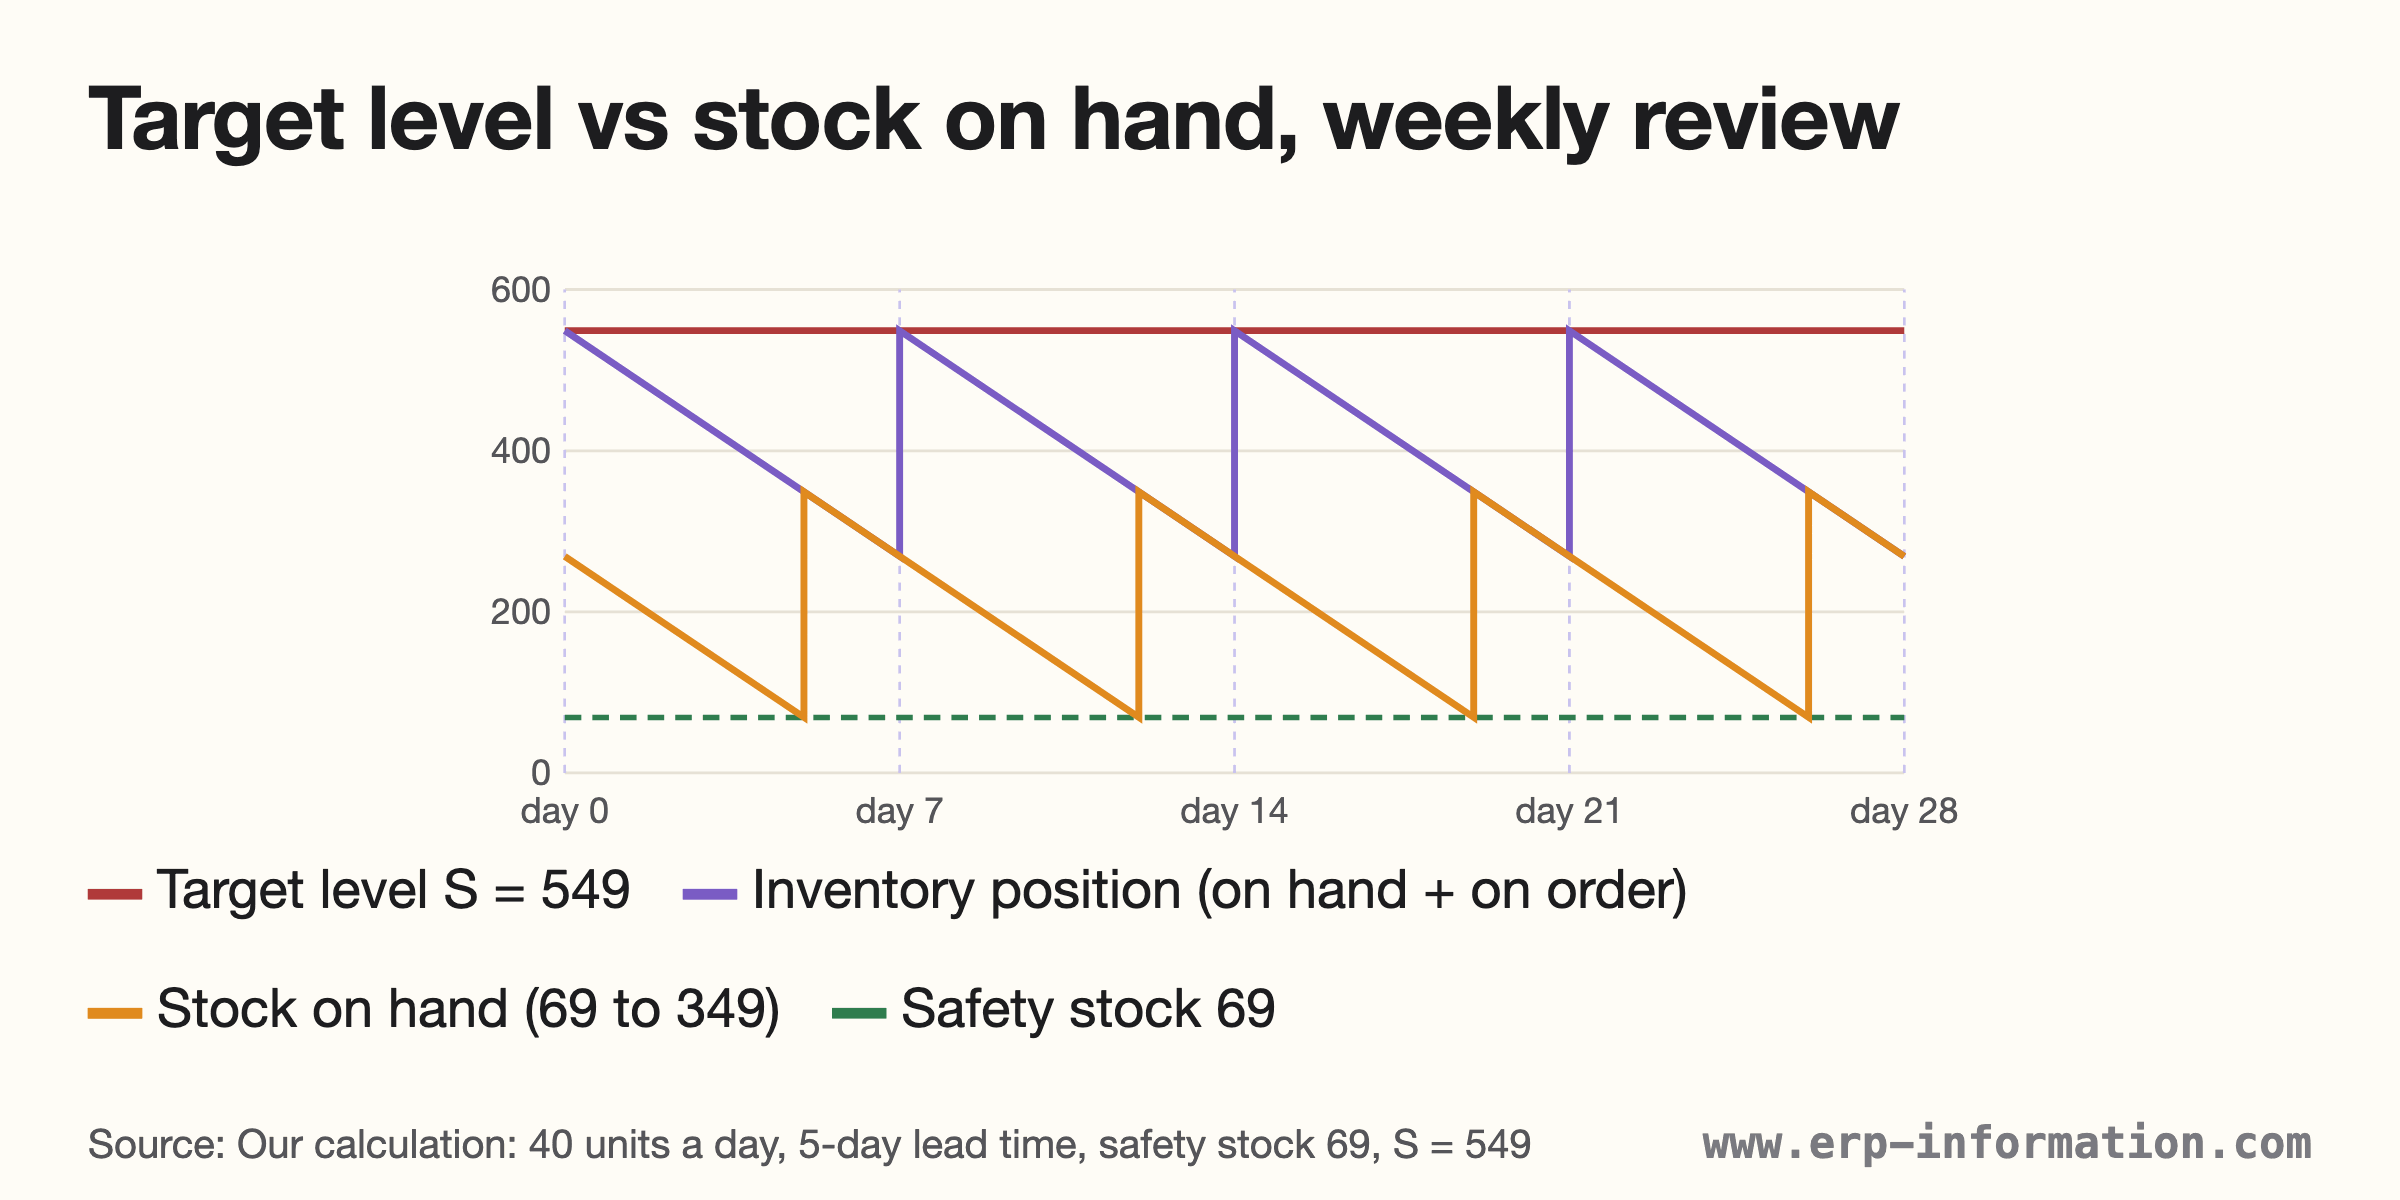
So the target is a position, not a shelf count. Stock on hand peaks just after a delivery and runs down toward the safety stock before the next one; the target is reached only when stock on hand and stock on order are added together. The chart shows both lines for the worked example below.
Target Inventory Level Formula
Target inventory level = d × (R + L) + safety stock
- d = average demand per period, in the same time unit as R and L. If R and L are in days, d is demand per day.
- R = review period: the time between two reviews of the item.
- L = Lead time: the time from placing an order to having the stock available.
- Safety stock = the buffer for demand and supply variability over the same R + L, covered in the safety stock sections below.
Order quantity at each review = target inventory level − (stock on hand + stock on order − backorders)
MIT’s course material states the same thing: the order quantity is S minus the inventory position, where S is the expected demand over the lead time and the review period plus a safety factor times the forecast error over that period.
Worked example: 40 units a day, weekly review
| Input | Value |
|---|---|
| Average demand (d) | 40 units a day |
| Standard deviation of daily demand | 12 units |
| Review period (R) | 7 days |
| Lead time (L) | 5 days |
| Cycle service level | 95% (Z = 1.645) |
| Stock on hand at the review | 210 |
| Stock on order, not yet received | 150 |
| Backorders | 0 |
- Demand over R + L: 40 × (7 + 5) = 480 units.
- Safety stock: 1.645 × 12 × √12 = 68.4, rounded up to 69 units.
- Target inventory level: 480 + 69 = 549 units.
- Inventory position: 210 on hand + 150 on order − 0 backorders = 360 units.
- Order quantity: 549 − 360 = 189 units.
This is our calculation; the method follows the formulas above. Three shortcuts give a different answer:
| Shortcut | Result | What goes wrong |
|---|---|---|
| Order the target minus stock on hand | 339 ordered | Orders the 150 already on the way a second time |
| Safety stock over L only, not R + L | 45 safety stock | 24 units short: ignores the 7 days until the next review |
| Leave Z out of the formula | 42 safety stock | Same as Z = 1, about an 84% cycle service level, not 95% |
How the review period moves the target
Reviewing less often raises the target twice over: more demand to cover until the next order can arrive, and more safety stock, because demand varies over a longer window. MIT’s course notes put it the same way: a longer review period raises cycle stock linearly and safety stock non-linearly. For the same item:
| Review period | Demand over R + L | Safety stock | Target level |
|---|---|---|---|
| 7 days | 480 | 69 | 549 |
| 14 days | 760 | 87 | 847 |
| 30 days | 1,400 | 117 | 1,517 |
Target, peak and average stock are three different numbers
Because the target counts stock on order, you will not see it on the shelf. With steady demand in the worked example, stock on hand peaks at about safety stock plus one review period of demand (69 + 280 = 349) just after a delivery, and averages about safety stock plus half a review period of demand (69 + 140 = 209). The target is 549. These two shelf figures are our calculation for steady demand; real demand moves them around.
Target level vs min-max vs reorder point
The three common replenishment rules differ in when they order and how much. MIT’s notation names them:
| Policy | When it orders | How much |
|---|---|---|
| Periodic review (R, S) | Every review period R | Target S minus inventory position |
| Min-max (s, S) | When inventory position falls to the minimum s | Maximum S minus inventory position |
| Reorder point (s, Q) | When inventory position falls to the reorder point s | A fixed quantity Q |
In every case the trigger and the order are based on inventory position, not on stock on hand alone. The University of Iowa’s course notes define the reorder point as “the inventory position which triggers the placing of a replenishment order”.
Five Major Zones of the Stock Level of Inventory
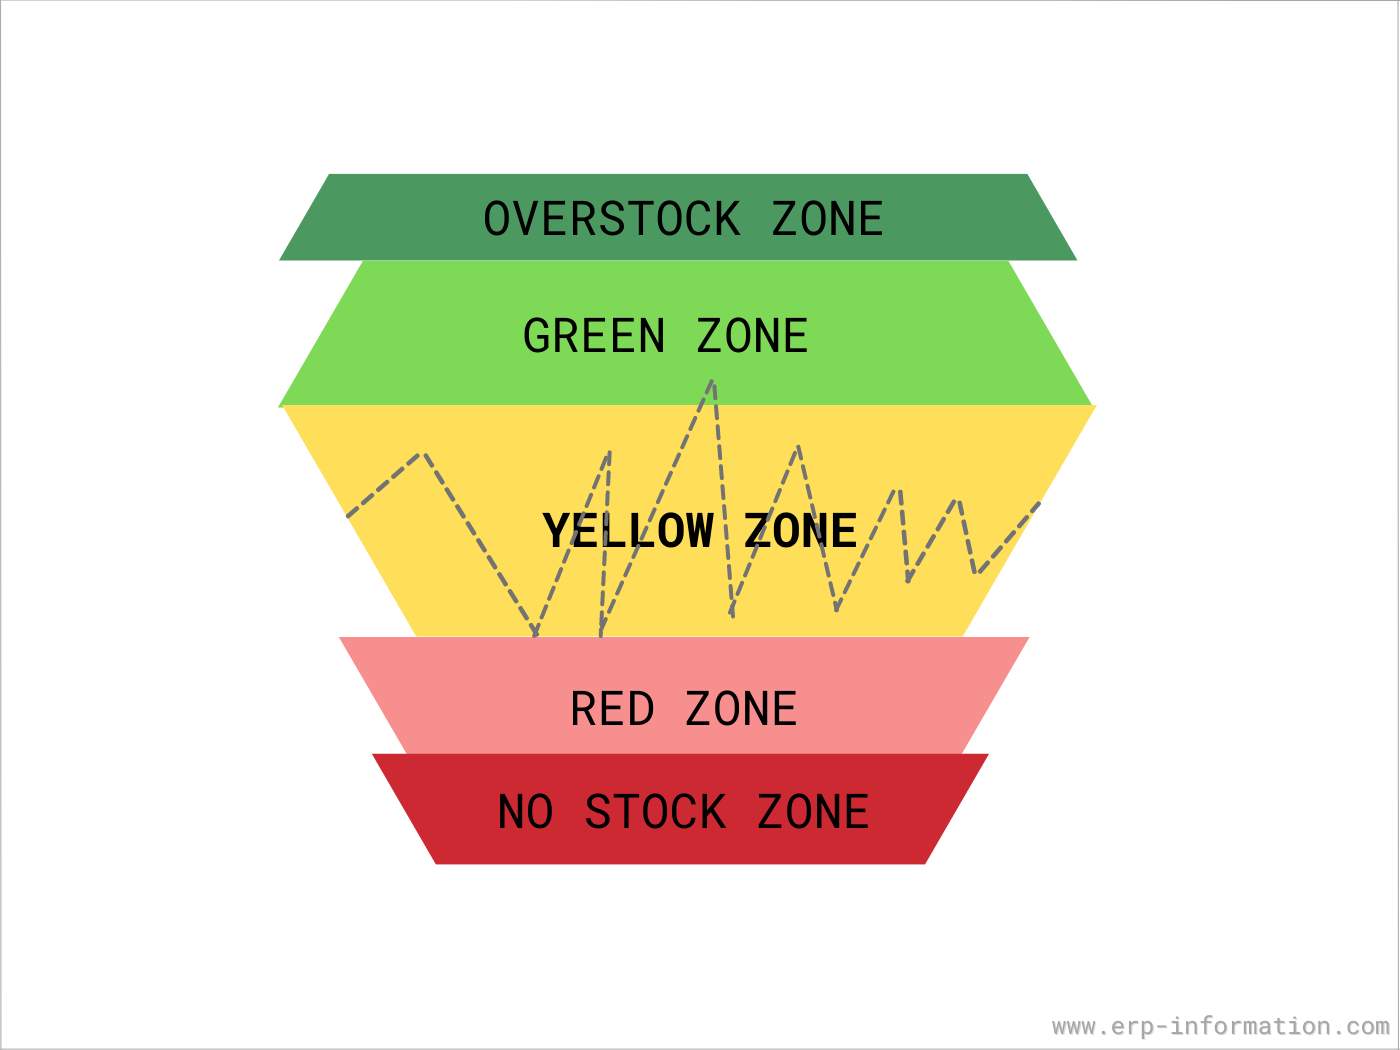
The five zones below are a practical color scheme for reading where stock sits against its planned levels, not a formal standard. The closest formal model is the Demand Driven Institute’s DDMRP, which uses three buffer zones, red, yellow and green, treats stock above the top of green as an excess situation, and treats a stockout as a separate alert rather than a zone.
1. No Stock Zone
Stock is zero and any new demand becomes a backorder or a lost sale. DDMRP does not count this as a zone; it raises a stockout alert instead.
2. Red Zone
The lowest band, the buffer you plan to keep. In DDMRP the red zone is red base plus red safety: the red base is sized from the yellow zone with a lead time factor, and red safety adds a variability factor.
3. Yellow Zone
The working band where replenishment is triggered. In DDMRP the yellow zone is average daily usage times the decoupled lead time, and a new order is raised when the net flow position (on hand plus on order minus qualified demand) falls into yellow or red.
4. Green Zone
The top band, which sets order size and frequency. In DDMRP the green zone is the largest of yellow times a lead time factor, the minimum order cycle and the minimum order quantity, and the top of green (red plus yellow plus green) is the level orders replenish to, the counterpart of a maximum or target level.
5. Over Stock Zone
Stock above the top of green. DDMRP calls this over top of green, a situation that signals an excessive inventory position.
Optimum inventory levels
There is no single optimum quantity. The target moves with demand, lead time, the review period and the service level you choose, as the tables above show.
Safety Stock
Safety stock is, in the ANSI Z94 wording, “A quantity of stock planned to be in inventory to protect against fluctuations in demand and/or supply.” It is part of the target level, not something added on top of it.
The simplest rule is days of cover: safety stock = average daily sales × number of safety days, where the number of safety days is the cover you choose to hold. It needs no statistics, but because the days are a judgment rather than a measurement, it does not tie the buffer to any stated service level. Peter King, writing for APICS in 2011, notes that rules of thumb like a flat 10 or 20 percent of cycle stock “generally result in poor performance” compared with a statistical method.
Safety Stock Formula
The statistical formulas below set safety stock for a chosen cycle service level, through the service factor Z. Use the one that matches the variability you actually have:
- Demand varies, lead time is reliable: SS = Z × σd × √(R + L) for periodic review. King’s rule is to scale the standard deviation of demand to the total lead time, including any review period; for continuous review use √L.
- Lead time varies, demand is steady: SS = Z × d × σL, where σL is the standard deviation of lead time.
- Both vary, independently: SS = Z × √(L × σd² + d² × σL²). Note which terms are squared: the two standard deviations and average demand, not the average lead time.
- Both vary and move together: King says the combined formula cannot be used, and safety stock is the sum of the two separate calculations: (Z × σd × √L) + (Z × d × σL).
- Max-average: (maximum daily demand × maximum lead time) − (average daily demand × average lead time). It is common in software vendors’ guides, but we found no textbook or standards source for it, and it does not target a stated service level.
Two details decide whether the answer is right. First, σd is the standard deviation: average the squared differences from the mean demand, then take the square root. NIST’s statistics handbook puts it plainly: “the standard deviation is the square root of the variance”. Skipping the square root leaves the variance, in squared units. Second, keep Z: leaving it out is the same as Z = 1, which the normal table puts at about an 84% cycle service level.
| Cycle service level | Z |
|---|---|
| 90% | 1.282 |
| 95% | 1.645 |
| 98% | 2.054 |
| 99% | 2.326 |
Cycle service level is the chance of no stockout in a replenishment cycle. Fill rate, the share of demand met from stock, is a different measure and is usually much higher for the same safety stock, so say which one a target refers to.
Online calculators for these formulas:
- Online Safety Stock Calculator With Ave-Max Formula
- Online Safety Stock Calculator With Lead Time Uncertainty
- Online Safety Stock Calculator With Demand Uncertainty
- Online Safety Stock Calculator With Demand and Lead Time Uncertainty
| Method | Safety stock formula |
|---|---|
| Days of cover | Average daily demand × safety days |
| Max-average (rule of thumb) | (Max daily demand × max lead time) − (average daily demand × average lead time) |
| Demand variability | Z × σd × √(R + L), or √L for continuous review |
| Lead time variability | Z × d × σL |
| Both, independent | Z × √(L × σd² + d² × σL²) |
| Both, dependent | (Z × σd × √L) + (Z × d × σL) |
Target Inventory Level vs Safety Stock
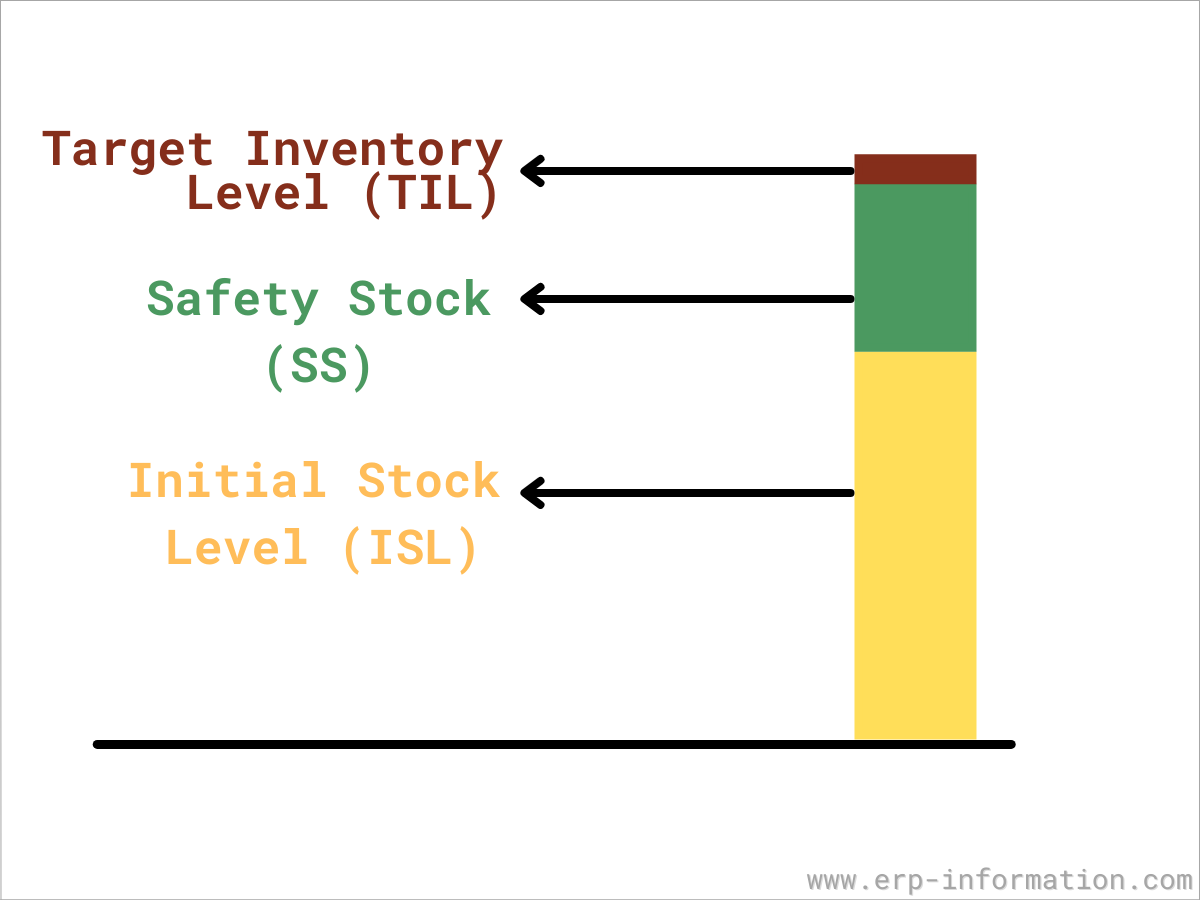
Safety stock is one part of the target level: the target covers expected demand until the next order can arrive (d × (R + L)) plus the safety stock for variability over that time.
| Target inventory level | Safety stock | |
|---|---|---|
| What it is | Order-up-to level for inventory position | Buffer for demand and supply variability |
| Formula | d × (R + L) + safety stock | Z × σd × √(R + L), or a variant above |
| Changes with | Demand, review period, lead time, service level | Variability, review period, lead time, service level |
Safety Stock vs Cycle Stock
Cycle stock, in the ANSI Z94 terminology, is “One of the two main components of any item inventory, the other being safety stock. The cycle stock is the most active component depleting gradually and replenished cyclically.”
| Cycle stock | Safety stock |
|---|---|
| The stock used up between deliveries to meet expected demand | Extra stock held against unexpected demand or supply chain disruptions |
| Rises with each delivery and runs down until the next | Planned to stay in inventory as a buffer |
| Grows with order size and the review period | Grows with variability and the service level chosen |
Evaluate Cycle Service Level using our Cycle Service Level Calculator Online
What ERP systems call the target level
Most ERP systems implement this as a maximum in a min-max rule rather than as a pure every-review target:
| System | Setting | How the order is worked out |
|---|---|---|
| SAP S/4HANA | Maximum stock level with lot size HB, used with reorder point planning or MRP | Replenishes up to the maximum once stock plus firmed receipts falls below the reorder point |
| SAP Retail | Target stock (static or dynamic) | Target stock minus expected stock at the end of the lead time |
| Dynamics 365 SCM | Coverage code Min/Max; the Minimum field holds the safety stock | Maximum minus predicted on-hand, when stock is projected below the minimum |
| Business Central | Reordering policy Maximum Qty. with Reorder Point and Maximum Inventory | The gap to Maximum Inventory, less supply already ordered |
| Oracle Fusion | Min-max planning | Up to the maximum when on hand plus on order is below the minimum |
| NetSuite | Preferred Stock Level and Reorder Point | (Preferred stock level + quantity needed) minus (quantity available + quantity on order) |
| Odoo 20 | Reordering rule Min and Max | Up to Max when forecast stock falls below Min, rounded up to any multiple |
| ERPNext | Re-order Level and Re-order Qty | No maximum field: a material request is raised at the level |
| TallyPrime | Reorder level and minimum order quantity | No maximum: the shortfall, or the minimum order if larger |
Two practical points follow. None of the vendor pages we read describes a pure fixed-interval order-up-to policy; each maximum waits for stock to cross a minimum or reorder point, so check how often your system checks it before you treat its maximum as a weekly target. And rounding can move the order past the maximum: Odoo rounds the order quantity up to the next multiple, and Microsoft notes that a multiple can leave stock above or below the maximum. In SAP, the term target stock also means dynamic safety stock in some settings, so read which one a screen uses. Our guide to inventory covers how these settings fit the wider process.
FAQs
What are inventory levels?
Inventory levels are the quantities of an item you track: stock on hand, stock on order, backorders and committed stock, and the planned levels you set against them, such as the reorder point, safety stock and the target or maximum level.
What is the target inventory level?
It is the order-up-to point in a periodic review system: the inventory position, meaning stock on hand plus stock on order minus backorders, that each order raises an item to. It equals expected demand over the review period plus the lead time, plus safety stock.
How do you calculate the target inventory level?
Multiply average demand per day by the review period plus the lead time in days, then add safety stock. At each review, order the target minus the current inventory position. For example, 40 units a day, a 7-day review, a 5-day lead time and 69 units of safety stock give a target of 549.
Is the target inventory level the same as the maximum stock level?
In a min-max system, yes: the maximum is the order-up-to level. The difference is timing. A periodic review target is ordered up to at every review, while most ERP maximums are ordered up to only after stock falls below a minimum or reorder point.
Why is stock on hand always below the target level?
Because the target counts stock on order as well as stock on hand. With steady demand, stock on hand peaks at about safety stock plus one review period of demand just after a delivery, which is well below the target.
What is cycle stock?
Cycle stock is the part of inventory that is used up between deliveries and replenished on each cycle. Together with safety stock it makes up an item’s inventory.
Setting a target level: a checklist
- Fix the review period: how often you will look at this item and order.
- Measure average demand and its standard deviation per day, or per week if you review weekly.
- Choose a cycle service level and read its Z from the table.
- Calculate the target: d × (R + L) + Z × σd × √(R + L).
- At each review, subtract the inventory position, not the stock on hand.
- Recalculate when demand, lead time or the review period changes.
How we researched this page (11 October 2026). Formulas and definitions come from MIT’s logistics course notes and MITx supply chain lessons, University of Iowa course notes, the NIST statistics handbook, the ANSI Z94 terminology published by IISE, Peter King’s 2011 APICS article and the Demand Driven Institute’s DDMRP dictionary. ERP settings come from SAP, Microsoft, Oracle, NetSuite, Odoo, ERPNext and TallyPrime documentation read the same day. The worked example and tables are our calculations. This rewrite corrected earlier errors on this page: it had called the target the quantity held at a given moment, left Z out of one table row, stopped the standard deviation steps at the variance, said a missing Z meant about 50 percent service rather than about 84 percent, and presented the five color zones as a standard.
References
- MIT OpenCourseWare ESD.260J: Inventory theory, lecture 11 (policies and notation)
- MITx CTL.SC1x: Periodic review key concepts
- University of Iowa: Reorder point lecture notes
- NIST/SEMATECH e-Handbook: Cumulative distribution function of the standard normal
- NIST/SEMATECH e-Handbook: Measures of scale
- King, P. L. (2011). Crack the code: understanding safety stock. APICS magazine
- IISE: ANSI Z94.14 Operations and Inventory Planning and Control terminology
- Demand Driven Institute: DDMRP terms dictionary (2020)
- Winter Simulation Conference 2019: DDMRP buffer zone equations
- Microsoft Learn: Safety stock and Min/Max (Dynamics 365 SCM)
- Microsoft Learn: Reordering policies (Business Central)
- Oracle Fusion Cloud SCM 26C: Min-max planning
- Oracle NetSuite: Order Items
Using Google Search? Add erp-information.com as a preferred source.