Acceptable Quality Level (AQL) is the quality level a buyer and supplier agree is the worst that can still be tolerated on average, and the sampling tables built around it turn that agreement into a rule an inspector can apply: check this many units, and reject the lot at this many defects.
The single most common mistake is worth clearing up first. AQL is not a share of the lot you are allowed to ship defective. An AQL of 2.5% on a 500-unit order does not mean 12 bad units are acceptable. It means you inspect a sample of 50 and reject the whole lot at 4 or more defects. The number that matters is the acceptance number, and it comes off the table, never off a percentage of the order.
What is Acceptable Quality Level (AQL)?
ISO 2859-1 defines it as the worst tolerable process average when a continuing series of lots is submitted for acceptance sampling. Every part of that phrase does work:
- Process average: it describes the supplier’s ongoing output, not one shipment.
- Continuing series of lots: the guarantee is statistical and only meaningful across repeated deliveries. A single inspection of a single lot proves much less than people assume.
- Worst tolerable: it is a limit you accept reluctantly, not a target to aim at. A supplier running exactly at the AQL is performing at the worst level the contract permits.
The standards now prefer the name acceptance quality limit for exactly that reason. ‘Level’ invited people to read it as a target, and ‘limit’ does not. Both names refer to the same thing and both are still in everyday use.
At the AQL, a sampling plan is built to accept the lot about 95% of the time. That 5% chance of rejecting acceptable goods is the supplier’s exposure, and it is called the producer’s risk.
How AQL sampling works
Every AQL decision follows the same five steps. The tables do steps three and four for you.
- Count the lot. The lot size is the quantity offered for inspection, not the total order, if the order ships in parts.
- Choose an inspection level. General Inspection Level II is the default for ordinary visual checks and is what almost every consumer-goods buyer uses.
- Look up the sample size code letter from the lot size and the inspection level.
- Read the sample size and the accept/reject numbers for each AQL you have agreed.
- Draw that many units at random, inspect, and compare. Defects at or below the acceptance number accept the lot; the rejection number, which is always one higher, rejects it.
Randomness in step five is not a formality. Units taken off the top of a pallet, or handed over by the factory, are not a random sample, and the probabilities the table promises no longer hold.
Acceptable Quality Level example
Take a 500-unit order inspected at General Inspection Level II with the usual consumer-goods AQLs of 0 critical, 2.5 major and 4.0 minor.
| Step | Where it comes from | Result |
|---|---|---|
| Lot size | Units offered for inspection | 500 |
| Inspection level | Buyer’s choice, default for visual checks | General II |
| Sample size code letter | Lot 281 to 500 at General II | H |
| Sample size | Code letter H | 50 units |
| Critical, AQL 0 | Zero tolerance | Accept 0, reject at 1 |
| Major, AQL 2.5 | Row H of the sampling table | Accept 3, reject at 4 |
| Minor, AQL 4.0 | Row H of the sampling table | Accept 5, reject at 6 |
So the inspector pulls 50 units, not 500 and not 12. Three worked outcomes:
- 0 critical, 3 major, 5 minor: accepted. Every count sits on or below its acceptance number.
- 0 critical, 4 major, 1 minor: rejected. Majors reached the rejection number, and the classes are judged separately rather than pooled.
- 1 critical, 0 major, 0 minor: rejected. A single critical defect ends the inspection.
Why 3 defects in 50 is still an AQL of 2.5%. Three out of fifty is 6%, which looks far too generous until you remember what the AQL describes. The plan is not asking whether this sample is 2.5% defective. It is asking whether the evidence is consistent with a supplier whose long-run average is 2.5% or better, and with only 50 units the answer has to leave room for ordinary sampling variation. Tighten that acceptance number and you would reject good suppliers most of the time.
Categories of defects
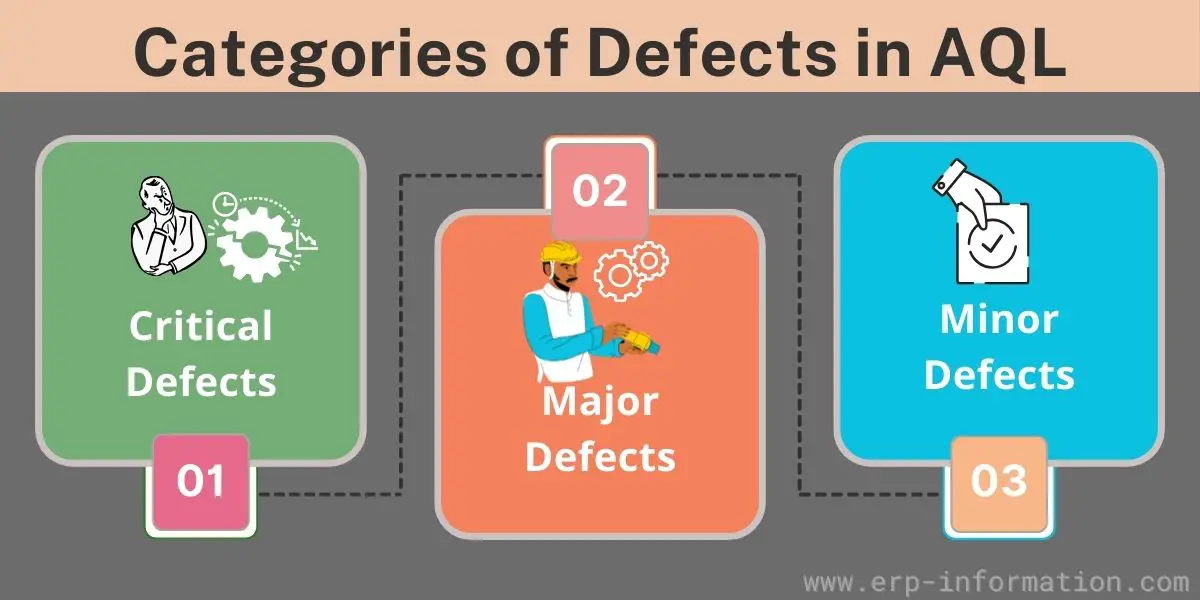
Defects are graded by consequence, and each grade gets its own AQL and its own accept/reject count in the same inspection.
| Class | What it means | Usual AQL |
|---|---|---|
| Critical | A defect judgment and experience indicate is likely to produce hazardous or unsafe conditions for whoever uses or maintains the product, or that breaches a legal or regulatory requirement. | 0 |
| Major | A defect likely to result in failure or to reduce usability materially. The end customer would probably return the item. | 2.5 |
| Minor | A departure from the specification that is unlikely to affect usability. Most buyers would keep the item. | 4.0 |
An AQL of 0 for critical defects is not a column in the standard table. It is a convention meaning the acceptance number is zero, so one critical defect in the sample rejects the lot. Sharp edges on a toy, a missing safety earth, a prohibited substance and a missing regulatory mark are all critical whatever the cosmetic quality of the rest of the shipment.
The 0 / 2.5 / 4.0 split is a widely used default, not a rule. Medical devices, automotive safety parts and aerospace components are routinely inspected far tighter, and the values belong in the purchase contract rather than being assumed.
How to read the AQL table
Two tables are used together. The first converts a lot size into a code letter, and the second turns that letter into a sample size and the accept/reject numbers.
Step 1: lot size to code letter
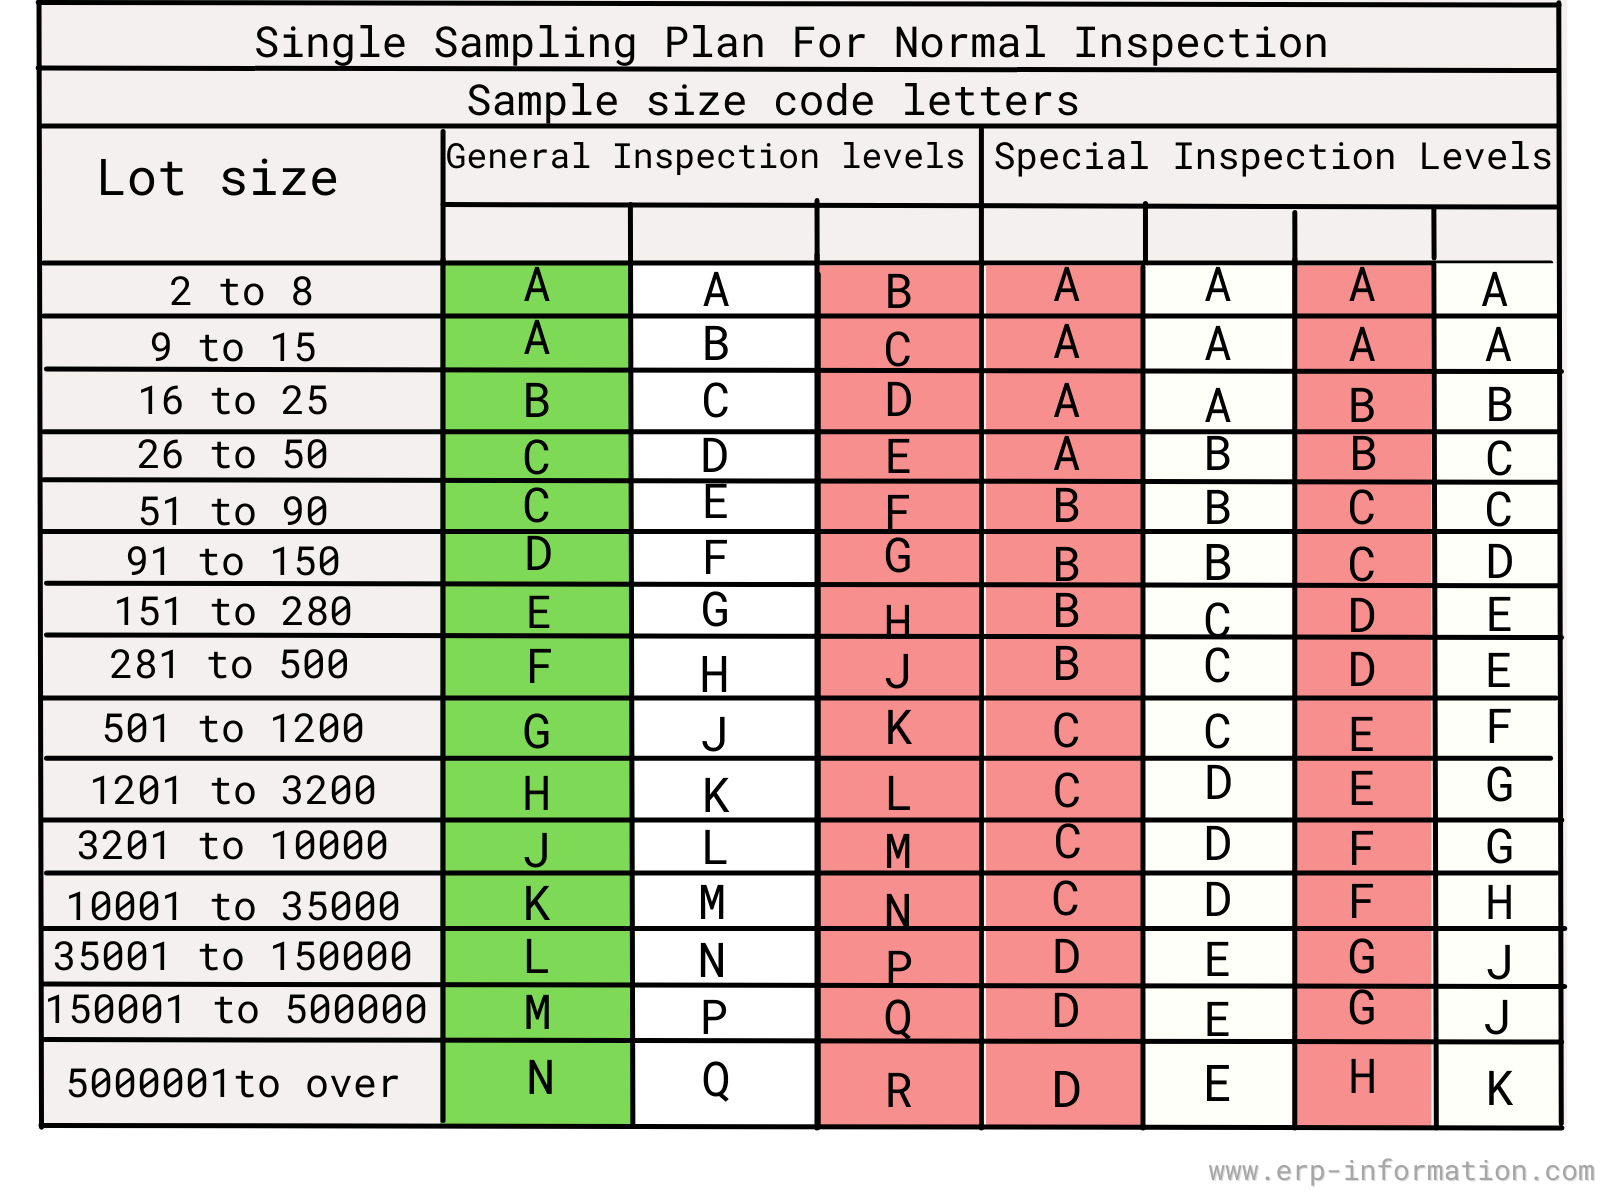
Read down to your lot size, then across to your inspection level. The General columns run I, II and III left to right, and the Special columns run S-1 to S-4. For everyday visual inspection you want the General II column:
| Lot size | Code letter (General II) | Sample size |
|---|---|---|
| 2 to 8 | A | 2 |
| 9 to 15 | B | 3 |
| 16 to 25 | C | 5 |
| 26 to 50 | D | 8 |
| 51 to 90 | E | 13 |
| 91 to 150 | F | 20 |
| 151 to 280 | G | 32 |
| 281 to 500 | H | 50 |
| 501 to 1,200 | J | 80 |
| 1,201 to 3,200 | K | 125 |
| 3,201 to 10,000 | L | 200 |
| 10,001 to 35,000 | M | 315 |
| 35,001 to 150,000 | N | 500 |
| 150,001 to 500,000 | P | 800 |
| 500,001 and over | Q | 1,250 |
Note how slowly the sample grows. Multiplying the lot by twenty, from 500 to 10,000, only multiplies the sample by four. That is the point of statistical sampling, and it is why inspecting a fixed percentage of every order is both wasteful on large lots and far too weak on small ones.
Step 2: code letter to accept and reject numbers
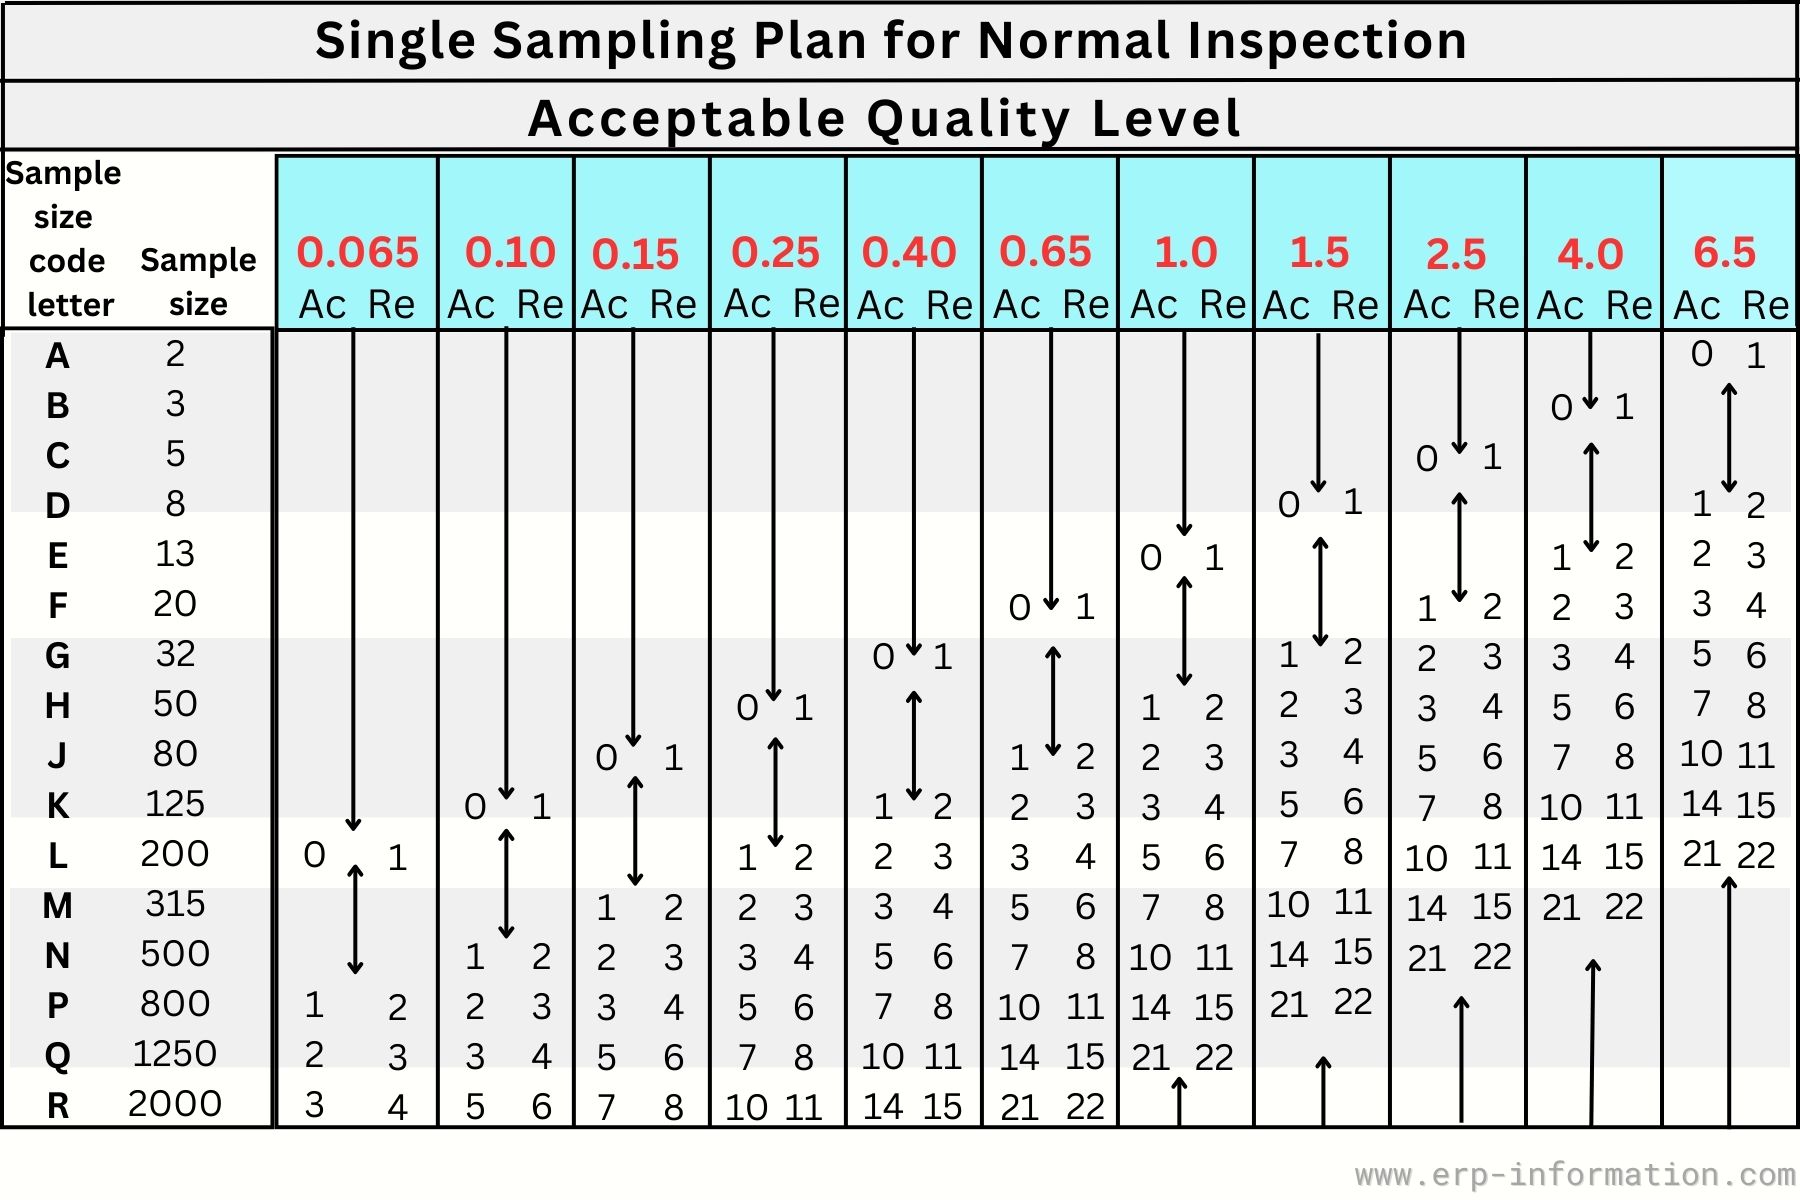
Find your code letter on the left, then read across to the column for the AQL you agreed. Each column gives a pair: Ac is the most defects you may find and still accept, and Re, always Ac plus one, is the count that rejects the lot. Row H at AQL 2.5 reads 3 and 4, which is where the worked example above comes from.
An arrow instead of a pair means this combination has no plan of its own: follow the arrow to the first row it points to and use that plan, including its sample size. That is the step most often missed, because following an arrow usually changes how many units you have to inspect.
Inspection levels
The inspection level decides how much evidence you buy. It does not change what counts as a defect.
| Level | Sample size | When it is used |
|---|---|---|
| General I | Smallest | Trusted suppliers, long records, or where inspection is expensive relative to risk |
| General II | Default | Standard visual inspection. The great majority of pre-shipment inspections |
| General III | Largest | New suppliers, a history of rejections, or high-consequence products |
| Special S-1 to S-4 | Much smaller | Destructive, costly or slow tests such as drop, pull or lab checks, where a full General sample is impractical |
Special levels buy far less confidence, which is the trade for not destroying the shipment. They are for tests you cannot run at volume, not a shortcut for ordinary visual inspection.
AQL, RQL and the risk either side
AQL fixes the good end of the scale. Two more quantities fix the rest, and they are routinely confused.
| Term | What it is | Typical setting |
|---|---|---|
| AQL | The worst process average still tolerated. Lots at this quality are accepted most of the time. | About 95% chance of acceptance, so a 5% producer’s risk |
| RQL (also LTPD) | The quality level considered clearly unacceptable, expressed as a percent defective. The plan is built to reject it almost always. | About 10% chance of acceptance, the consumer’s risk |
| IQL | The indifference quality, sitting between the two. | About 50% chance of acceptance |
RQL is a quality level, not a count of defects. It is a percentage describing how bad a lot would have to be before the plan almost always catches it. It is never ‘the number of defects at which this batch gets rejected’ – that number is the rejection number Re, and the two are unrelated quantities that happen to sit near each other in a lot of explanations.
Plot acceptance probability against true defect rate and you get the operating characteristic curve, which is the honest picture of any sampling plan. It never drops from accept to reject at a single point. It slopes, and the gap between AQL and RQL is that slope. Buying a steeper curve, meaning better discrimination, costs sample size and nothing else.
Types of sampling plan
The tables publish several plan families. They differ in how many samples you may need, not in how strict they are, and are built to give roughly equivalent protection.
| Plan | How it runs | Trade-off |
|---|---|---|
| Single | Draw one sample of n. Accept if defects are at or below Ac, reject at Re. | Simplest to administer and to audit. Largest average number of units inspected |
| Double | Draw a first, smaller sample. Clearly good accepts and clearly bad rejects immediately; only an inconclusive result triggers a second sample, judged on the cumulative count. | Fewer units inspected on average, at the cost of a two-stage procedure |
| Multiple | The same idea extended to a sequence of up to seven small samples, each with its own cumulative accept and reject numbers. | Fewest units of the fixed-sample plans. Most administration |
| Sequential | Inspect unit by unit, comparing the running total against accept and reject boundaries after each one, and stop the moment either is crossed. | Most efficient in units inspected. Needs a disciplined inspector and no fixed end point |
| Skip-lot | Once a supplier has a strong record, inspect only a fraction of presented lots. | Large savings. Only defensible with a qualified, stable supplier |
A worked double-sampling plan makes the mechanism concrete. With a first sample of 315 units, accept at 7 or fewer defects and reject at 11 or more. Between 8 and 10 you learn nothing conclusive, so you draw a second 315 and judge the two together: accept at 18 or fewer, reject at 19 or more. Most lots settle at the first stage, which is where the saving comes from.
None of these is 100% inspection, in which every unit in the lot is checked. That is not a sampling plan at all, and it is neither free nor perfect: inspector fatigue on repetitive checks means it typically catches well short of every defect.
Switching rules: why AQL only works over a series of lots
This is the part most explanations leave out, and it is what makes the AQL guarantee real. Inspection severity is meant to move with the supplier’s record:
- Normal to tightened when 2 of 5 consecutive lots are rejected. Acceptance numbers get stricter.
- Tightened back to normal after 5 consecutive lots are accepted.
- Normal to reduced after 10 consecutive accepted lots, with production steady and the responsible authority agreeing. Samples get smaller.
- Stop accepting the supplier’s lots if tightened inspection persists without improvement, until the underlying cause is fixed.
Run the tables without the switching rules and you have thrown away the mechanism that catches a supplier drifting. A buyer who inspects every lot at normal severity forever is not operating the standard, only borrowing its arithmetic.
Where AQL fits, and where it does not
Acceptance sampling decides what to do with product that already exists. It sorts lots; it does not improve them. That boundary is worth holding on to.
- It is a filter, not a control. W. Edwards Deming argued that inspecting quality into a product is the expensive way to get it, and that the effort belongs upstream in the process. Statistical process control tells you a process is drifting while you can still act; an AQL inspection tells you only that a finished lot passed or failed.
- Accepting a lot is not certifying it. An accepted lot at 2.5% AQL may still contain defective units, and on a large order it certainly will. Acceptance means the evidence was consistent with an agreed standard.
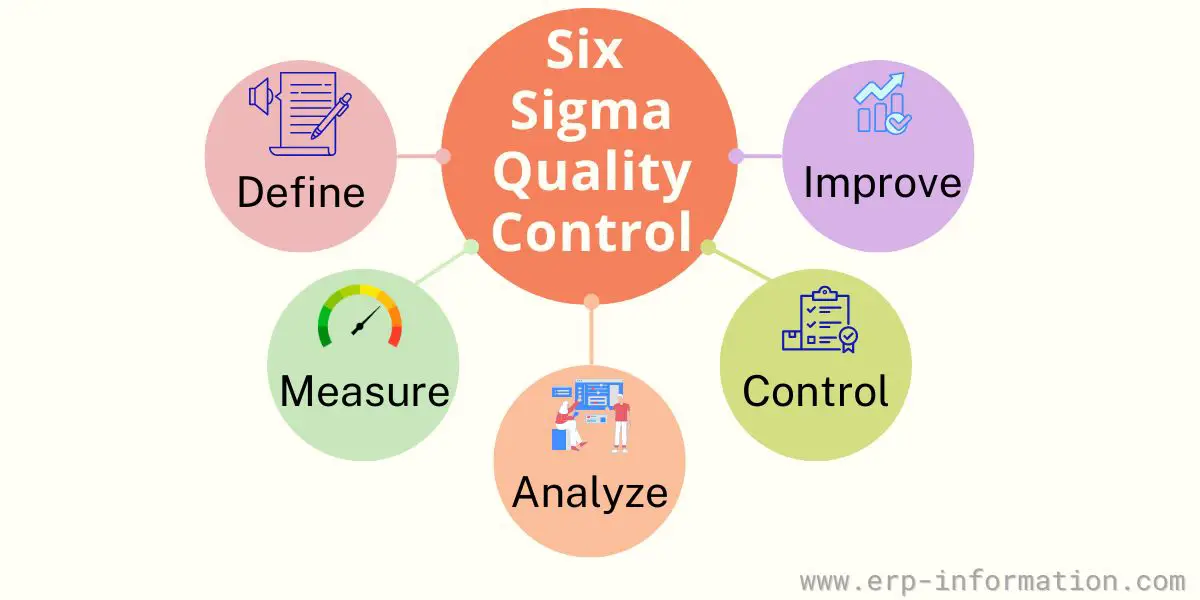
- Six Sigma works in a different register. A process at Six Sigma capability runs at about 3.4 defects per million opportunities. Percentage-based AQLs are coarse next to that, which is why mature manufacturers move from acceptance sampling toward capability indices and process control.
- Some sectors reject the logic entirely. Zero acceptance number (c=0) plans reject a lot on a single defect found, and are common in pharmaceutical, medical device and aerospace supply chains where the cost of one escape is not comparable to the cost of inspection.
In practice AQL results are most useful as a supplier record rather than a pass/fail stamp. Inspections feeding a vendor rating and a supplier evaluation and risk rating turn isolated decisions into the trend that actually predicts the next shipment. Upstream they pair with statistical process control, which watches the process rather than the finished lot, and with the zero defects mindset that treats an agreed defect allowance as a floor to be beaten rather than a budget to be spent.
Standards to cite in a contract
| Standard | Scope | Note |
|---|---|---|
| ISO 2859-1 | Sampling procedures for inspection by attributes, indexed by acceptance quality limit | The international standard, used worldwide in trade |
| ANSI/ASQ Z1.4 | The US equivalent for attributes | Current edition ANSI/ASQ Z1.4-2003, reaffirmed as (R2018). Descends from MIL-STD-105E, which was withdrawn in 1995 |
| ANSI/ASQ Z1.9 | Sampling by variables, for measured characteristics | Used when the characteristic is a measurement rather than pass/fail. Smaller samples, but it assumes a distribution |
| GB/T 2828.1 | The Chinese national equivalent of ISO 2859-1 | Frequently named in contracts with Chinese suppliers |
Name the standard, the inspection level, the severity and the AQL for each defect class in the purchase order. ‘Inspected to AQL 2.5’ is not a specification, because it settles none of those.
FAQs
What is an AQL table?
An AQL table is the pair of lookup tables from ISO 2859-1 and ANSI/ASQ Z1.4 that convert a lot size and an inspection level into a sample size and a pass/fail rule.
The first table gives a sample size code letter, and the second gives the sample size with an acceptance number (Ac) and a rejection number (Re) for each AQL. It tells you how many units to inspect and at how many defects to reject the lot.
Does an AQL of 2.5% mean 2.5% of my order can be defective?
No. This is the most common misreading of AQL. The percentage is not a share of the lot you may ship defective, and you never calculate 2.5% of the order quantity.
AQL 2.5 is the worst long-run process average that will still usually be accepted. For a 500-unit lot at General Level II it produces a sample of 50 units with an acceptance number of 3, so the lot is rejected at 4 or more major defects.
What does an AQL of 4.0 mean?
AQL 4.0 is the level normally applied to minor defects, meaning cosmetic departures from specification that would not stop most buyers using the product.
It is more permissive than the 2.5 used for major defects. On a 50-unit sample it allows up to 5 minor defects and rejects the lot at 6.
What is the difference between AQL and RQL?
AQL is the worst process average still tolerated, and a plan accepts lots at that quality about 95% of the time. RQL, also called LTPD, is the quality level considered clearly unacceptable, which the plan is built to accept only about 10% of the time.
Both are quality levels expressed as a percent defective. Neither is a count of defective units, which is a frequent confusion: the count that rejects a lot is the rejection number Re from the table.
What are critical, major and minor defects?
A critical defect is one likely to create hazardous or unsafe conditions for a user, or that breaches a legal requirement, and it is normally given an AQL of 0 so a single one rejects the lot. A major defect is likely to cause failure or a customer return and usually carries an AQL of 2.5. A minor defect is a cosmetic departure from specification and usually carries 4.0.
Each class is counted and judged separately in the same inspection rather than added together.
Which inspection level should I use?
General Inspection Level II is the default and covers the great majority of routine visual inspections.
Use Level III for a new supplier, a poor track record or a high-consequence product, Level I when a supplier is well proven and inspection is costly, and the Special levels S-1 to S-4 only for destructive or expensive tests where a full sample is impractical.
Conclusion
AQL is a decision rule, and it only means anything when the four things it depends on are written down: the standard, the inspection level, the severity and an AQL for each class of defect. Given those, the tables produce a sample size and an acceptance number, and the inspection stops being a matter of judgment.
The habit worth building is reading the acceptance number rather than the percentage. The percentage describes a supplier’s process over many shipments; the acceptance number is what applies to the lot in front of you. Confusing the two is what produces the belief that an AQL of 2.5% licenses 2.5% bad product, and it is the reason so many AQL arguments between buyers and suppliers are really arguments about arithmetic.