
Delivery performance measures how reliably you deliver what a customer ordered, in the quantity ordered, by the date agreed. The headline formula is short:
On-time delivery % = (Deliveries made on time ÷ Total deliveries) × 100
The arithmetic is the easy part. The hard part, and the reason two companies with identical operations can report 98% and 71%, is everything the formula leaves unstated: which date you measure against, whether a partial shipment counts, whether early counts as late, and whether you count orders, order lines or units.
This guide gives the formulas that matter (on-time delivery, OTIF, fill rate, perfect order), a worked month of orders scored five different ways, and the measurement choice that decides your number before any goods move: requested date versus confirmed date.
What is Delivery Performance?
Delivery Performance is an organization’s ability to supply goods and services as per the standards expected by its customers.
It is measured from the customer’s side of the transaction, not yours. A shipment that left your dock on time but arrived late is not on-time delivery; it is on-time shipment, which is a different (and easier) metric. Mixing the two is the most common way a delivery performance number ends up flattering.
It is also a reliability measure rather than a speed measure. A supplier quoting 12 weeks and hitting 12 weeks every time is performing better than one quoting 2 weeks and delivering in 3. Customers plan around the promise, so the promise being true matters more than the promise being short.
There are two types,
Operational
Measures how efficiently an organization can produce and supply goods or services per the standards.
Strategic
Look at long-range plans and whether they have been aligned with organizational goals.
Delivery Performance KPIs
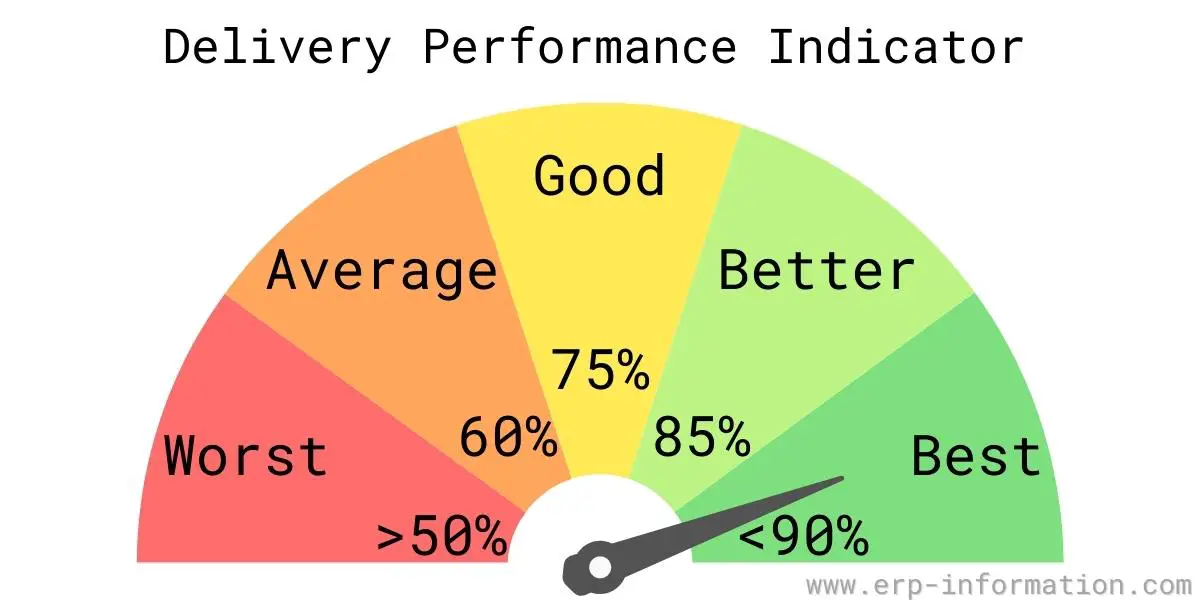
Four metrics do the real work, and they get progressively stricter. Running only the first one is why a supply chain can look healthy on a dashboard while customers complain.
| Metric | Formula | What it catches | What it misses |
|---|---|---|---|
| On-time delivery (OTD) | (On-time deliveries ÷ total deliveries) × 100 | Lateness | Short shipments. A half-empty pallet that arrives on the right day scores 100% |
| Fill rate | (Quantity delivered ÷ quantity ordered) × 100 | Completeness | Lateness. A complete order three weeks late scores 100% |
| OTIF / DIFOT on time in full | (Deliveries both on time and in full ÷ total deliveries) × 100 | Both together | Damage, wrong documentation, wrong location |
| Perfect order | (Perfect orders ÷ total orders) × 100 | Everything the customer experiences | Nothing much, which is why it is the hardest to score well on |
OTIF is unforgiving by design, and that is the point. An order delivered on the right day but 90% complete does not score 90%. It scores zero for that delivery. The metric is binary per delivery, then averaged.
Perfect order is the formal version. In the ASCM SCOR reference model it is Perfect Order Fulfillment (RL.1.1), a level-1 reliability metric, and an order only counts if every component is right: delivered in full, on the committed date, with accurate documentation, and in perfect condition (SCOR tracks that last one separately as Customer Order Perfect Condition, RL.2.4). An order is perfect only if every line on it is perfect.
The documentation component surprises people. A shipment that is complete, on time and undamaged still fails a perfect-order test if the paperwork is wrong, because a customer who cannot receive the goods into their system has not been served.
Fill rate is three different numbers, so say which one you mean
“Fill rate 95%” is ambiguous until you state the unit of measure. The same shipment produces three different scores:
| Variant | Counts | Order of 3 lines, 100 units each, one line short by 50 |
|---|---|---|
| Unit fill rate | Units shipped ÷ units ordered | 250 ÷ 300 = 83.3% |
| Line fill rate | Complete lines ÷ total lines | 2 ÷ 3 = 66.7% |
| Order fill rate | Complete orders ÷ total orders | 0 ÷ 1 = 0% |
All three are correct. Reporting the flattering one without labelling it is how supplier scorecards stop being comparable. Fix the definition once, in writing, and apply it to every supplier.
What You Need to Measure Delivery KPIs
You do not need a new system to measure this. You need four date fields and two quantity fields, captured consistently. Almost every ERP already holds them; the usual problem is that nobody agreed which ones to use.
| Field | Why it matters |
|---|---|
| Customer requested date | What the customer originally asked for. The honest denominator |
| Confirmed / committed date | What you promised back. The date most scorecards actually use |
| Original confirmed date | The first promise, before any reschedules. Without this, re-confirmations are invisible |
| Actual delivery date | Goods receipt at the customer, not goods issue from your dock |
| Quantity ordered / quantity delivered | Per line, so fill rate and OTIF are computable at all |
The third row is the one most implementations skip, and it is the one that makes the metric trustworthy. If your system overwrites the confirmed date each time a promise slips, the report can only ever compare a delivery against the last promise made, which the next section explains is close to meaningless.
In SAP this is the distinction between delivery performance measured to request date and to confirmation date; the two reports run off the same sales orders and routinely disagree by double digits.
Contributing Factors for Delivery Performance
1. On-time and in-full delivery from the suppliers
Once an order is placed, it is equally essential that the vendors provide the required items as promised without any changes in the quantity. That will ensure a smooth production process. To improve on-time delivery, the organization has to boost the operation of all the departments by improving planning, monitoring, and working efficiency.
2. Preparing proper manufacturing schedules
The firm will break down its overall production into various segments and concentrate on fulfilling each segment’s needs to ensure uninterrupted manufacturing.
3. Inventory management
This is important as it ensures enough raw materials for production and enough finished products to dispatch customer orders.
4. Transportation requirements
This will help to calculate and check the number of times the logistics were correct and, if they were wrong, how the business can aim to correct them to ensure no further mistakes.
Delivery Performance Metrics
The number of deliveries: This represents the total deliveries fulfilled within a month, potentially extending to a quarter or week. Additionally, you might factor in the average delivery count.
The number of on-time deliveries: Represents deliveries made punctually to customers, serving as a vital indicator of delivery performance quality.
Accuracy in order fulfillment can be measured by computing the order accuracy rate by comparing error-free orders against the total orders received.
The order accuracy rate formula is as follows.
Order accuracy rate = (Total orders – Error orders) / Total orders * 100
Transportation time: This metric overviews the time to transit the products from pick-up to drop-up locations. That helps to measure the speed of the drivers and the efficiency of the transporting routes.
The capacity of the means of transportation: It measures the vehicle’s capacity to transport the products. Calculate vehicle capacity by comparing available capacity and the total capacity of that vehicle. That helps to know the inefficiency in loading the products.
Average time per delivery: The average time taken to complete a delivery. It helps to measure the efficiency of the supply chain network.
The average delivery cost: It is calculated depending on the distance, products, and type of vehicle.
Delivery Performance Formula
The core delivery performance indicator is on-time delivery, and it is a simple ratio: how many deliveries hit the agreed date, out of how many you made.
On-time delivery % = (Number of deliveries made on time ÷ Total number of deliveries) × 100
Two details decide whether the result means anything. Count deliveries, not percentages: the numerator is a count of on-time deliveries, not an already-computed percentage. And pick your unit and stay with it: orders, order lines and shipments give different answers on the same month, so a scorecard that silently switches between them is not a trend, it is noise.
Check our online delivery performance calculator.
Calculation of on-time delivery rate
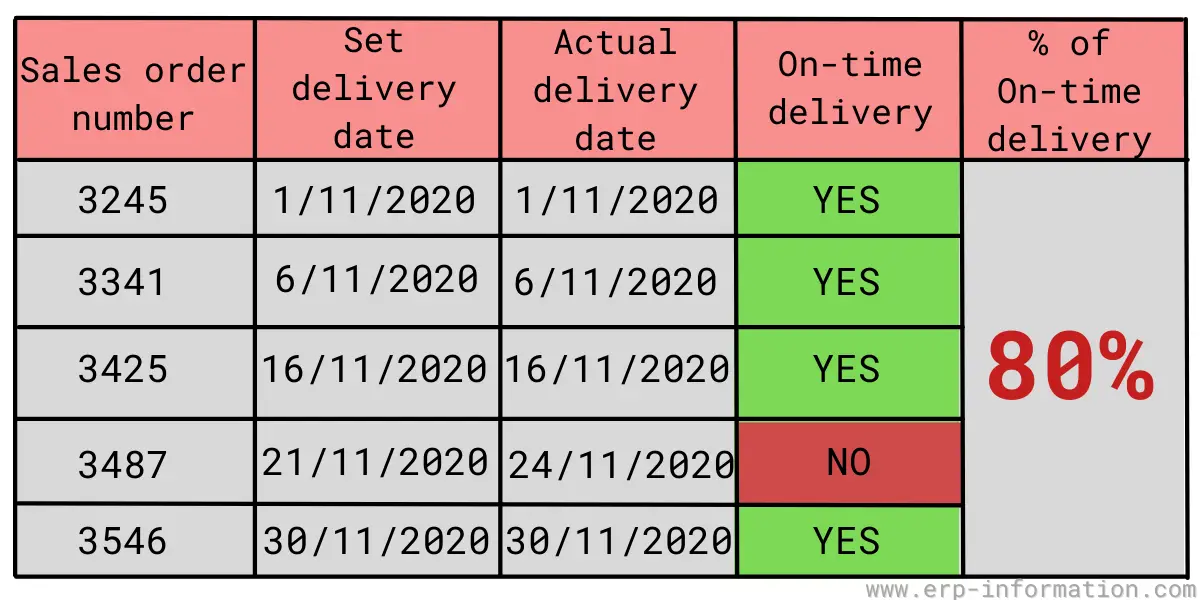
| Sales order | Set delivery date | Actual delivery date | On time? |
|---|---|---|---|
| 3245 | 1 Nov 2020 | 1 Nov 2020 | Yes |
| 3341 | 6 Nov 2020 | 6 Nov 2020 | Yes |
| 3425 | 16 Nov 2020 | 16 Nov 2020 | Yes |
| 3487 | 21 Nov 2020 | 24 Nov 2020 | No, 3 days late |
| 3546 | 30 Nov 2020 | 30 Nov 2020 | Yes |
Four of five deliveries hit the date, so on-time delivery = (4 ÷ 5) × 100 = 80%. Note what the number does not tell you: whether those four were complete, and whether 21 November was the date the customer asked for or a date renegotiated after the order was placed. Both questions are handled below.
You can run this calculation on your own figures with our delivery performance calculator.
Which date do you measure against? This decides your number
This is the single most consequential choice in delivery performance measurement, and it is settled before a single item moves. There are three candidate dates:
- Customer requested date. What the customer originally wanted. The strictest and the most honest, because it is the date their own plan was built around.
- Original confirmed date. The first date you promised back when you accepted the order.
- Current confirmed date. The promise as it stands today, including every reschedule.
Measuring against the current confirmed date is the most common setup and the least informative, because the target moves. If a promise can be revised on the day before it is due, a supplier can approach 100% on-time delivery without ever delivering when the customer asked. The metric stops measuring reliability and starts measuring how diligently the order book is maintained.
This is not a theoretical worry. Research by Janet Godsell, cited in the standard reference on DIFOT, found that suppliers meeting an OTIF target against their own promised delivery date would often fail the same measure once the customer’s requested date was used instead.
The practical fix is to report two numbers side by side, not to pick a side:
| Measured against | Answers | Use it for |
|---|---|---|
| Requested date | Are we serving the customer’s actual need? | Customer experience, lost-sales risk, whether quoted lead times are honest |
| Original confirmed date | Do we keep the promises we make? | Execution reliability. The fairest supplier scorecard measure |
| Current confirmed date | Did we hit the most recent promise? | Day-to-day expediting. Not a performance measure |
If your reported delivery performance is above 95% while customers still escalate about late orders, the gap between the first and third rows is almost always the explanation. Add a reschedule count to the report (how many times each order’s confirmed date moved) and the picture resolves immediately.
Does an early delivery count as on time?
Usually not, and treating early as a pass is a quiet source of inflated scores. Goods arriving two weeks early consume the customer’s warehouse space, get invoiced sooner than planned, and in many contracts can be refused. That is why delivery performance is normally scored against a window rather than a single date, for example “on the agreed date, or up to two days early”.
Whatever tolerance you choose, define it explicitly, agree it with the customer or supplier, and apply it symmetrically. An undocumented tolerance is how two teams reading the same report reach different conclusions.
One month of orders, five different scores
Here is why “our delivery performance is 80%” is an incomplete sentence. Five orders, one month, one set of facts:
| Order | Requested | Confirmed | Delivered | Qty ordered | Qty delivered |
|---|---|---|---|---|---|
| A | 4 Mar | 4 Mar | 4 Mar | 100 | 100 |
| B | 7 Mar | 14 Mar | 14 Mar | 100 | 100 |
| C | 11 Mar | 11 Mar | 11 Mar | 100 | 60 |
| D | 18 Mar | 18 Mar | 22 Mar | 100 | 100 |
| E | 25 Mar | 25 Mar | 25 Mar | 100 | 100 |
| Metric | Working | Score |
|---|---|---|
| OTD vs confirmed date | A, B, C, E on time; D late → 4 ÷ 5 | 80% |
| OTD vs requested date | B was confirmed a week out and still misses the request; D late → 3 ÷ 5 | 60% |
| Unit fill rate | 460 units delivered ÷ 500 ordered | 92% |
| OTIF vs confirmed date | C on time but short, D late → 3 ÷ 5 | 60% |
| OTIF vs requested date | Only A and E are clean → 2 ÷ 5 | 40% |
Same month, same orders: 40% to 92% depending only on definitions. Nobody is lying in any of those rows. This is why the first thing to fix in a delivery performance report is not the performance, it is the definition, written down and agreed with the other party before it is used to judge anyone.
Importance of On-time Delivery
- It is a major KPI of delivery performance.
- It helps to monitor and analyze the delivery performance and hence increases efficiency.
- It helps to build trust with your customers.
- It helps to satisfy the customer and improves customer relationships.
- It indicates the efficiency of the supply chain.
- Enhances your reputation in customer place.
How to Achieve On-time Delivery?
- Track and analyze the reason for previous late delivery.
- Analyze the factors contributing to late delivery and find out the root cause.
- Take corrective actions and concentrate on processing it to avoid late delivery.
- Define a plan and implement it for corrective actions.
- Observe the result and update it accordingly.
How to Improve Delivery Performance?
Late deliveries lead to poor delivery performance. However, delivery performance can be improved by the following things:
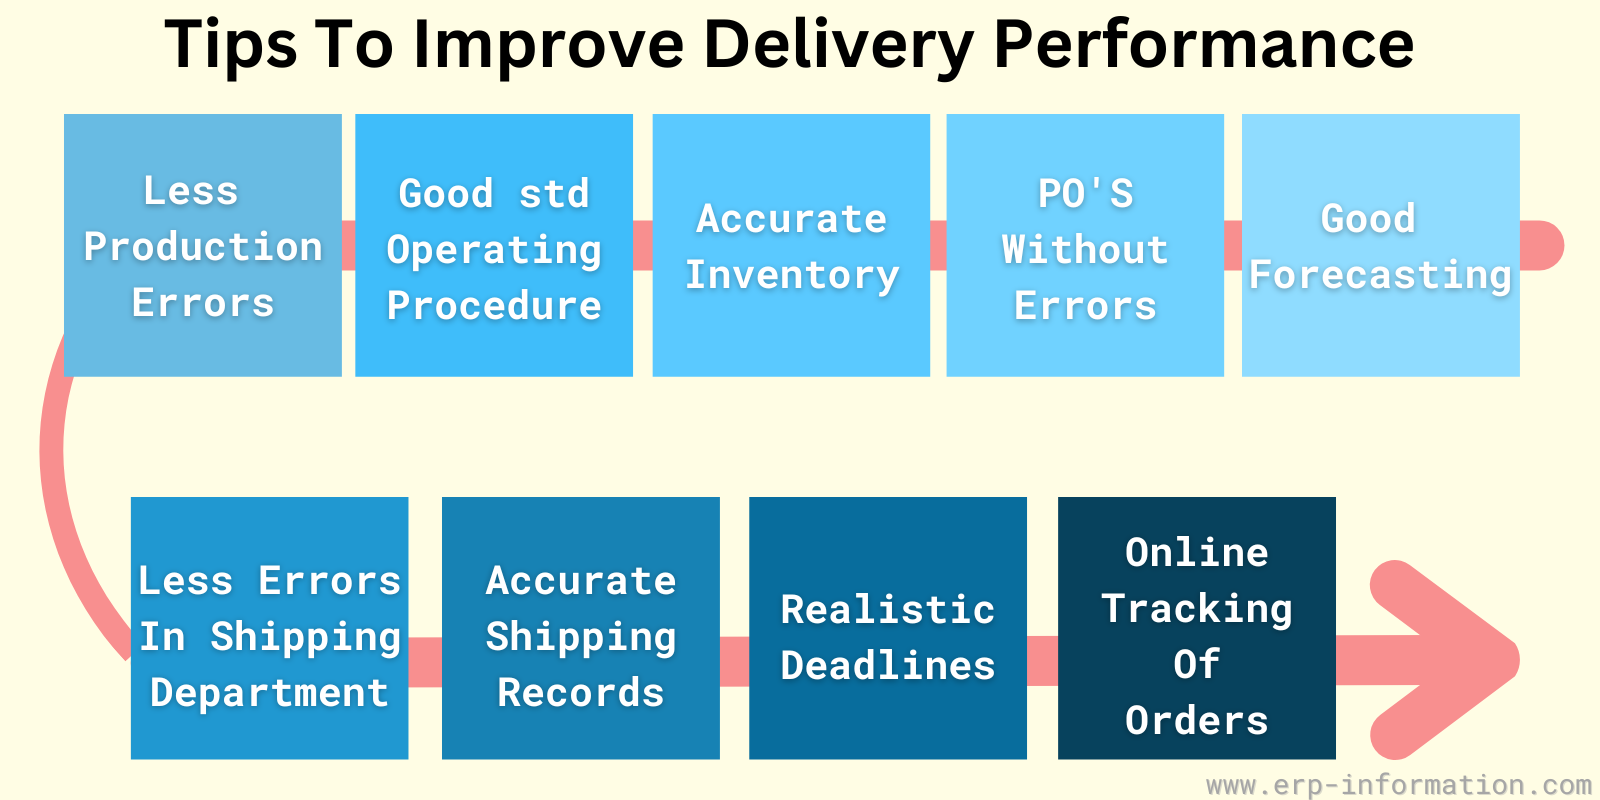
- Have good forecasting
- Have purchase orders without errors
- Maintain accurate inventory
- Maintain reasonable standard operating procedures
- Reduce production errors
- Reduce the picking and packing errors in the shipping department
- Do on-time delivery
- Maintain accurate shipping records
- Set realistic deadlines
- Provide online tracking to your customers for their orders
After determining the ideal performance level, the business needs to consistently assess and implement measures to uphold this standard, crucial for its credibility.
Identifying weaknesses and reducing stress can be achieved by establishing a learning index. Moreover, continual enhancement strategies will contribute to an overall improvement in delivery services.
FAQs
How do you calculate delivery performance?
Divide the number of deliveries made on time by the total number of deliveries in the period and multiply by 100. For example, 4 on-time deliveries out of 5 is (4 / 5) x 100 = 80%. Count deliveries rather than percentages in the numerator, and keep the unit consistent: orders, order lines and shipments will each give a different answer for the same month.
How do you calculate a supplier’s delivery performance?
Use the same ratio, but measure against the supplier’s ORIGINAL confirmed date rather than the current one. If you score against the latest confirmed date, a supplier can reschedule a promise the day before it is due and still record an on-time delivery. Reporting the reschedule count alongside the percentage makes that visible. Also decide in advance whether early deliveries pass, and apply the same tolerance to every supplier.
Is it better to average delivery performance monthly or to total it?
Total it. Sum the on-time deliveries and the total deliveries across the whole period and divide once. Averaging twelve monthly percentages gives every month equal weight regardless of volume, so a quiet month with 3 deliveries moves the annual figure as much as a peak month with 300. Use the monthly series to see the trend, and the pooled total to state the performance.
What is the difference between OTIF and on-time delivery?
On-time delivery only asks whether the delivery arrived by the agreed date. OTIF (on time in full, also called DIFOT) asks whether it arrived by the agreed date AND complete. OTIF is binary per delivery: an order that is on time but 90% complete scores zero for that delivery, not 90%. A supply chain will always report a lower OTIF than OTD, and the gap between them is the size of your short-shipment problem.
What is delivery performance to request date?
It measures deliveries against the date the customer originally asked for, rather than the date you confirmed back to them. It is the stricter of the two and usually the lower number, because it counts orders that were quoted a later date at the point of acceptance. Reporting both request-date and confirmed-date performance separates two different problems: quoting lead times the customer cannot live with, and failing to keep the promises you made.
Does an early delivery count as on time?
Usually not. Early goods take up the customer’s warehouse space, get invoiced ahead of plan, and may be refused under the delivery terms. Most scorecards therefore score against a window, such as on the agreed date or up to two days early, rather than a single date. The tolerance matters less than writing it down and applying it consistently in both directions.
What is a good delivery performance percentage?
There is no single authoritative benchmark, and any figure quoted without stating the measurement basis is close to meaningless, since the same operation can report 40% or 92% depending on definitions. Commonly cited targets are 95% or better for on-time delivery, with world-class operations aiming higher. The more useful question is whether the number is measured against the requested date or a revised confirmed date, and whether it is trending up.
What is the delivery performance report?
A recurring report showing, for a defined period, how many deliveries were made, how many met the agreed date, how many were complete, and where the failures came from. A useful one breaks results down by customer, product and cause, states which date it measures against, and includes the reschedule count. Without that last item the report cannot distinguish a supplier who delivers reliably from one who simply keeps moving the promise.
Conclusion
Most delivery performance problems are not measurement problems, but most delivery performance arguments are. Before trying to raise the number, make sure everyone reading it agrees on four things: which date it is measured against, whether early counts as on time, whether the unit is orders, lines or shipments, and whether completeness is included.
Then report two figures rather than one: performance against the original confirmed date, which tells you whether you keep your promises, and performance against the requested date, which tells you whether those promises were any use to the customer. When the two diverge, the problem is usually in order promising rather than in the warehouse.
Sources
- SCOR Digital Standard, Version 14.0, ASCM, 2025. Perfect Order Fulfillment (RL.1.1) as a level-1 reliability metric and Customer Order Perfect Condition (RL.2.4) as a level-2 metric.
- DIFOT (delivery in full, on time), including Janet Godsell’s finding on promised versus requested delivery dates.
Using Google Search? Add erp-information.com as a preferred source.