
Projected available balance (PAB) is the stock you expect to have at the end of each future period. ASCM defines it as “the running sum of on-hand inventory minus requirements plus scheduled receipts and planned orders.” Planners read it week by week: where it would fall below zero, or below safety stock, the master schedule needs another lot.
It is a planning figure in inventory management and master scheduling, not an accounting balance. ASCM, the Association for Supply Chain Management, lists projected available inventory as a synonym.
It is also not the same as projected on hand. ASCM defines projected on hand as the projected available balance “excluding planned orders”. Projected on hand shows when you would run out if nobody acted. PAB shows the balance after the plan’s own orders.

Projected available balance definition
About the video (checked 28 October 2026): it dates from 2022. Its first formula, on-hand plus scheduled receipts minus total demand, leaves out planned receipts, so it gives projected on hand rather than PAB. Its first-period formula subtracts safety stock, which JD Edwards and SAP do but ASCM’s definition does not. The sections below give the full rules.
ASCM’s key word is running. Each period starts from the previous period’s balance, so one wrong week carries into every week after it.
The supply side is stock on hand, scheduled receipts and planned orders. A scheduled receipt, in ASCM’s words, is “An open order that has an assigned due date”. For an end item, the planned orders are the master production schedule (MPS) quantities.
The demand side is customer orders and forecasts from demand management. For a component it is the gross requirements passed down from the parent items.
A negative balance is the signal. NetSuite’s planning glossary puts it plainly: “demand for an item is greater than its supply.” The gap is the net requirement, “the amount needed to raise the projected available balance to zero or more”.
So the rule is simple. If PAB stays at zero or above (or at safety stock or above, where one is held), no new MPS quantity is needed. If it would drop below, the plan adds a lot, sized by the item’s lot-sizing rule, for example a fixed 60 units.
Projected available balance formula
PAB is calculated one period at a time. The first period starts from stock on hand:
PAB (week 1) = on-hand + scheduled receipts + MPS receipts − demand
PAB (week n) = PAB (week n−1) + scheduled receipts + MPS receipts − demand
Oracle E-Business Suite writes the same balance as “(nettable quantity on hand + scheduled receipts + planned orders) minus demand (gross requirements)”. Its projected on hand drops the planned orders: “(nettable quantity on hand + scheduled receipts) – gross requirements”.
That second version is the shortcut an earlier version of this page called PAB. It is useful, but it answers a different question: when you run out if nothing new is planned.
Which demand counts: the demand time fence
Near-term weeks use orders, not forecast. In ASCM’s words, the demand time fence is the point “inside of which the forecast is no longer included in total demand and projected available inventory calculations. Inside this point, only customer orders are considered.”
Oracle gives the reason: the planner builds to sales orders only inside the fence “to reduce the risk of carrying excess inventory”. Our frozen zone guide compares how each ERP names and sets its fences.
Beyond the fence, ASCM says total demand “is a combination of actual orders and forecasts, depending on the forecast consumption technique chosen.” The rule is a setting, not a law:
- JD Edwards World rule C uses “Whichever is greater, forecast or customer demand”.
- JD Edwards World rule S uses the forecast alone beyond the fence.
- NetSuite “uses the demand source setting” outside the fence.
The “greater of” rule is forecast consumption done within one week. JD Edwards says so: “the forecast is reduced by the amount of the customer demand on that same time bucket.”
With a forecast of 40 and orders of 10, 30 units of forecast remain, so demand is 30 + 10 = 40. With orders of 45, the forecast is used up and demand is 45. Oracle records an unmatched excess like that 5 as overconsumption, “for information purposes only”.
Consumption can also reach across weeks. Oracle lists “backward and forward consumption days and forecast bucket type” as factors, so a weekly grid can differ from what the system shows.
Safety stock: subtracted, or a floor?
ASCM’s definition has no safety stock term, and neither does Oracle’s formula. Odoo 20’s master production schedule suggests the replenishment “needed to reach the Safety Stock Target”, so safety stock is the floor the balance is kept above.
Two major systems subtract it instead. In JD Edwards World, the first week starts at “+BA = quantity on hand – safety stock”. SAP S/4HANA’s net requirements calculation takes plant stock minus safety stock, plus receipts, minus requirements, and reports a shortage when the result is negative.
The orders come out the same either way. A balance with safety stock taken out falls below zero exactly when the full balance falls below safety stock. Only the number on screen differs, so check which convention you are reading before comparing two systems.
Projected available balance example
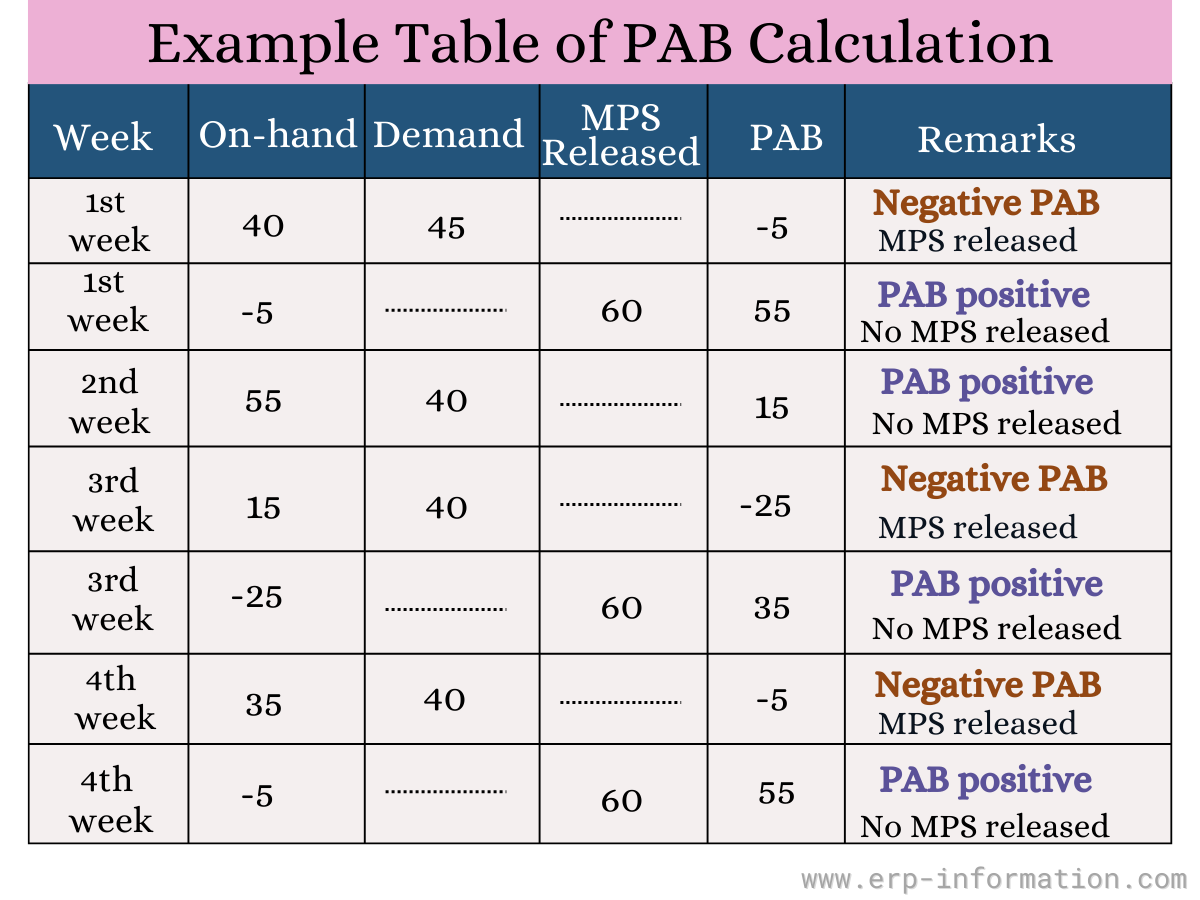
One end item in weekly buckets: 80 units on hand, a fixed MPS lot of 60, no safety stock. The demand and planning time fences both end after week 2. The numbers are our calculation, using the rules above: orders only inside the fence, the greater of forecast and orders beyond it.
| Week | Forecast | Orders | Demand used | Rule |
|---|---|---|---|---|
| 1 | 40 | 45 | 45 | Orders only (inside fence) |
| 2 | 40 | 30 | 30 | Orders only (inside fence) |
| 3 | 40 | 45 | 45 | Greater of the two |
| 4 | 40 | 10 | 40 | Greater of the two |
| 5 | 40 | 5 | 40 | Greater of the two |
| 6 | 40 | 0 | 40 | Greater of the two |
| Week | MPS receipt | PAB | Projected on hand | ATP |
|---|---|---|---|---|
| 1 | 35 | 35 | 5 | |
| 2 | 5 | 5 | ||
| 3 | 60 | 20 | −40 | 15 |
| 4 | 60 | 40 | −80 | 45 |
| 5 | 0 | −120 | ||
| 6 | 60 | 20 | −160 | 60 |
How each week works:
- Week 1: 80 − 45 = 35. No lot needed.
- Week 2: 35 − 30 = 5. The forecast of 40 is ignored inside the fence. Counting it would give 35 − 40 = −5 and call for a lot of 60 that only unbooked forecast justified.
- Week 3: orders of 45 beat the forecast, so demand is 45. 5 − 45 would be −40, so the MPS adds 60: 5 + 60 − 45 = 20.
- Week 4: the forecast of 40 beats orders of 10. 20 − 40 would be −20, so another 60: 20 + 60 − 40 = 40.
- Week 5: 40 − 40 = 0. Zero is not below zero, so no lot.
- Week 6: 0 − 40 would be −40, so 60 more: 0 + 60 − 40 = 20.
The projected on hand column is the same arithmetic without the MPS lots. It first goes negative in week 3: that is the week new supply must arrive.
Add 10 units of safety stock and week 2’s balance of 5 is already below the floor. That week is inside the planning time fence, so a system such as NetSuite raises an exception message for the planner instead of creating the order.
What is MPS?
The master production schedule (MPS) is the build plan for end items, not a piece of software. ASCM: “It represents what the company plans to produce, expressed in specific configurations, quantities, and dates. The MPS is not a sales item forecast that represents a statement of demand.”
In the PAB record, the MPS row holds the quantities that keep the balance from going negative. ASCM notes that “firm planned orders are the normal method of stating the master production schedule.”
Near-term weeks are protected by the planning time fence. ASCM: “Changes inside the planning time fence must be made manually by the master scheduler.” Oracle E-Business Suite “cannot suggest new planned orders for the item or suggest rescheduling existing orders for the item to an earlier date” inside it.
So a negative PAB inside the fence does not create an order by itself. NetSuite says “Exception Messages will be created to inform you that a projected negative balance exists within the time fence.” Beyond the fence, the planning run adds planned orders to cover it.
The formulas used by an MPS

The image above splits the calculation into three cases:
- PAB in the first period = on-hand inventory + MPS receipts − customer orders
- PAB after the first period, inside the demand time fence = prior period PAB + MPS receipts − customer orders
- PAB beyond the demand time fence = prior period PAB + MPS receipts − demand under your consumption rule (the greater of forecast and customer orders under JD Edwards rule C)
Add scheduled receipts to each line when open orders are due that week. Subtract safety stock from the first line only if your system works that way, as JD Edwards World does.
Projected available balance vs available to promise (ATP)
PAB asks whether you will run short. Available to promise asks how much you can still promise to new orders. ASCM: “The ATP quantity is the uncommitted inventory balance in the first period and is normally calculated for each period in which a master production schedule receipt is scheduled.”
The key difference is the forecast. The JD Edwards documentation states it directly: “Forecast is never included in ATP calculations.” PAB, beyond the demand time fence, does subtract forecast.
In the example above, discrete ATP in week 1 is 80 − (45 + 30) = 5, counting orders until the next MPS lot. In week 3 it is 60 − 45 = 15, in week 4 it is 60 − (10 + 5) = 45, and in week 6 it is 60.
Week 4 shows the difference. PAB subtracts the full forecast of 40, although only 10 units are ordered so far. ATP counts orders only: the week 4 lot of 60 minus the 15 units ordered in weeks 4 and 5 leaves 45 free to promise.
Odoo 20 shows the same idea as an option that compares “available stock ( Starting Stock – Actual Demand + Replenishment )” with forecasted stock.
To work through ATP yourself, use our available to promise calculator.
What each ERP calls projected available balance
The name is shared; the arithmetic is not. Every ERP system below documents its own version, and the differences are the first place to look when two systems disagree.
| System and its name for it | What it adds up | Safety stock |
|---|---|---|
| ASCM dictionary (the reference) projected available balance | On hand minus requirements, plus scheduled receipts and planned orders. Projected on hand is the same sum excluding planned orders. | Not part of the definition |
| Oracle E-Business Suite 12.2 projected available balance | (Nettable on hand + scheduled receipts + planned orders) minus gross requirements. Projected on hand drops the planned orders. | Not part of the formula |
| Oracle NetSuite projected available balance | ASCM’s wording. A negative balance becomes a net requirement that raises it to zero or more. | Not part of the definition |
| JD Edwards World ending available (EA) | Beginning available plus the week’s supplies minus its demand, with the planning fence rule choosing forecast, customer demand or the greater of the two. | Subtracted: week 1 starts at on hand minus safety stock |
| SAP S/4HANA 2025 available stock | Plant stock plus receipts minus requirements. Receipts include purchase orders, firmed procurement proposals and production orders. | Subtracted |
| Microsoft Dynamics 365 Business Central Projected Available Balance | Inventory + planned order receipt + scheduled receipt minus gross requirement. Planned order releases are not included. | Not part of the formula |
| Odoo 20 Forecasted Stock | Starting stock minus forecasted demand (and indirect demand) plus replenishment, at the end of each period. | A target: replenishment is suggested up to the safety stock target |
| ERPNext Projected Qty | Actual + planned + requested + ordered quantity, minus reserved quantities for sales, production, subcontracting and production plans. | Not in the formula; the figure is used to monitor safety stock levels |
One trap sits inside a single product. Business Central’s availability help describes the field as “the quantity on hand plus scheduled receipts minus gross requirements”. Its Power BI measure of the same name also adds planned order receipts, so check which one your screen shows.
How planners use the projected available balance
- Find the first shortage. The first week projected on hand turns negative (week 3 in the example) is when new supply must arrive.
- Size the order. The net requirement lifts PAB back to zero, or to safety stock; the lot-sizing rule rounds it up. Our planned order receipt guide shows the MRP version.
- Respect the fences. Inside the planning time fence, a negative PAB is a message for the planner, not an automatic order.
- Promise from ATP, not PAB. PAB holds room for forecast; ATP shows what booked orders leave free.
- Check capacity. An MPS that keeps PAB positive still has to be buildable. ASCM says the MPS must take into account availability of material and capacity; rough-cut capacity planning is the usual check.
FAQs
What is the projected on-hand inventory?
Projected on hand is the projected available balance without planned orders. ASCM defines it as projected available balance excluding planned orders, and Oracle E-Business Suite calculates it as nettable on hand plus scheduled receipts minus gross requirements. It shows when stock would run out if no new orders were planned.
Can the projected available balance be negative?
Yes, before the plan adds supply. A negative balance means demand is greater than supply in that period, so a receipt is needed, usually a lot sized by the lot-sizing rule. Inside the planning time fence, systems such as NetSuite raise an exception message for the planner instead of creating the order.
Is safety stock subtracted from the projected available balance?
It depends on the system. The ASCM definition, Oracle E-Business Suite and Business Central leave safety stock out of the balance formula, and Odoo 20 uses it as the floor the balance is kept above. JD Edwards World subtracts it from the first week, and SAP subtracts it in its net requirements calculation. The orders come out the same; only the balance shown differs by the safety stock.
What does PAB stand for in supply chain planning?
PAB stands for projected available balance, also called projected available inventory. It is the stock expected at the end of each future period after scheduled receipts, planned orders and demand.
What to check in your own system
Before you trust a PAB figure, or compare it with another system’s, check five settings:
- Planned orders: does the balance include them (PAB) or not (projected on hand)?
- Demand beyond the fence: the greater of forecast and orders, forecast only, or a demand source setting?
- Fence lengths: how many days the demand and planning time fences cover.
- Safety stock: subtracted from the balance, or used as the floor? Our safety stock calculator helps set the number itself.
- Lot size: the rule that turns a shortfall into an MPS quantity.
In production planning, two systems that disagree on these five settings can show different balances for the same item and the same orders. Start the comparison there.
Using Google Search? Add erp-information.com as a preferred source.