A master production schedule (MPS) is a plan that states exactly which finished products a manufacturer will build, in what quantities, and in which time periods. It takes the higher-level aggregate production plan and breaks it down into specific end items on a weekly or monthly timeline.
The MPS is the anchor of production planning. It drives material requirements planning (MRP), which explodes it into component and material orders, and it is the plan against which capacity and delivery promises are checked. This guide covers what goes into an MPS, how to read the MPS grid with a worked example, the manufacturing environments it suits, and free templates you can download.
Evaluate Production capacity using our Online Production Capacity Calculator.
Definition
A master production schedule works at the finished-goods, or end-item, level: not a rough total for a product family, but the specific products, in specific amounts, in specific weeks. It is a production planning tool that keeps production capacity, inventory, and customer demand aligned, which is what supports on-time delivery with less waste.
Two things sit downstream of the MPS and are often confused with it. The bill of materials (BOM) lists the components each end item needs, and material requirements planning (MRP) uses the MPS and the BOM together to work out when to order those components. The MPS does not contain the BOM or MRP. It is the plan that sets them both in motion.
Where the MPS fits in the planning hierarchy
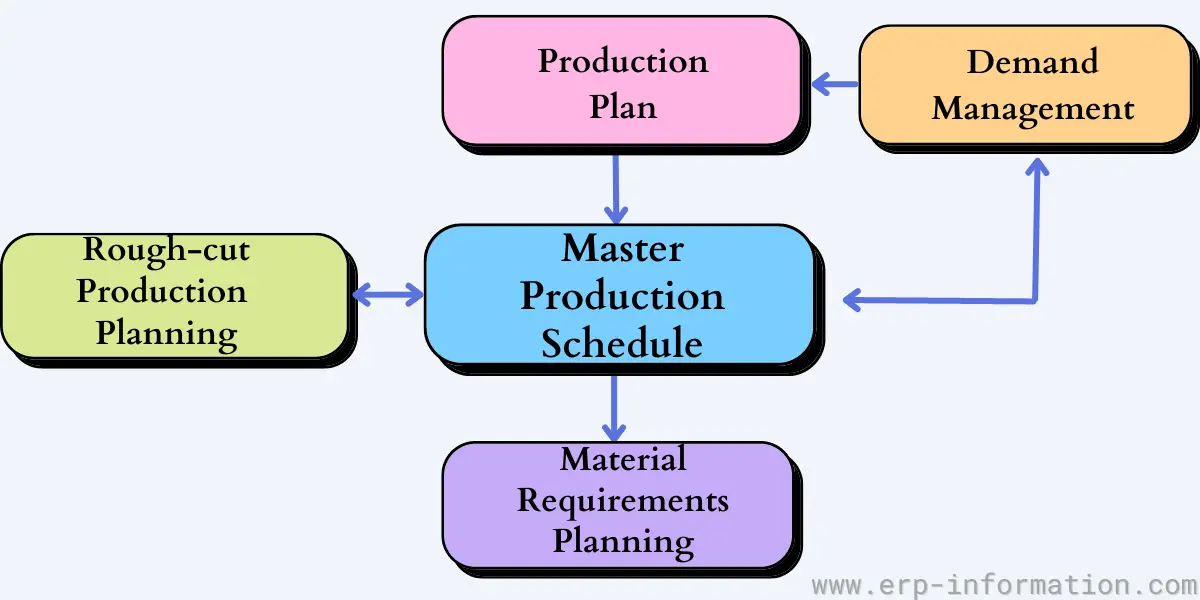
The MPS is the middle link in a chain that runs from broad plans down to detailed orders. Each level is more specific and shorter-term than the one above it:
- Aggregate plan sets total output by product family over months. Aggregate planning is the level above the MPS, not a synonym for it.
- Master production schedule (MPS) breaks that total into specific end items by week. This is the layer covered here.
- Material requirements planning (MRP) explodes the MPS through the BOM into component and material orders.
Before the MPS is trusted, its workload is sanity-checked against capacity by rough-cut capacity planning (RCCP), and the detailed MRP plan beneath it is checked in full by capacity requirements planning (CRP). That feedback loop is what keeps the schedule realistic rather than just optimistic.
Components
You can enhance your MPS and make it more effective by including essential components. Here are the four main components.
1. Product List
The product list is the foundation of your MPS. It includes all the items that your company plans to manufacture over a specified period. Each product on this list should have detailed descriptions, including:
- Product Name: The name of the item to be produced.
- SKU (Stock Keeping Unit): A unique identifier for each product.
- Description: Brief details about the product, including its features and intended use.
- ABC analysis: Identify the popular products by ABC analysis and keep them at the top of the list.
By clearly outlining the products, you ensure that everyone in the production process knows exactly what needs to be made.
Use our ABC Analysis Calculator to classify your products.
2. Variations of Sublists for Each Product
Within the main product list, you may have variations or sublists. These sublists account for different versions or models of each product. For example, if you manufacture smartphones, sublists might include different models, colors, storage capacities, and any other specifications.
- Model Variations: Different designs or versions of the same product.
- Specifications: Details like size, color, or additional features.
- Customization Options: Any customizable elements available for the product.
These sublists help in managing and planning for the production of multiple variants, ensuring that specific requirements for each variant are met without confusion.
3. Time Periods (Months, Weeks)
The time period component of an MPS breaks down the production schedule into manageable intervals. This can be organized into months, weeks, or even days, depending on the manufacturing cycle and business needs.
- Monthly Schedule: Long-term planning, useful for products with longer production cycles.
- Weekly Schedule: More detailed planning, allowing for adjustments based on demand and production capacity.
- Daily Schedule: For operations that require precise, day-to-day planning.
By defining clear time periods, you can better allocate resources, manage workloads, and ensure timely completion of production goals.
4. Production Quantities
The production quantities specify the number of units to be produced for each product or variant within a given time period. This component ensures that you meet customer demand without overproducing or underproducing.
- Demand Forecasting: Estimating the number of units needed based on market demand and historical data.
- Capacity Planning: Ensuring that the manufacturing facilities can handle the production volume.
- Inventory Levels: Balancing production to maintain optimal inventory levels, avoiding both shortages and excess stock.
Accurate production quantities help maintain a smooth workflow, optimize resource use, and meet customer expectations efficiently.
Importance of Master Production Schedule
MPS is an integral part of an Enterprise Resource Planning system. It provides the most effective planning functionality by extracting the actual demand and supply data to deliver precise production plans.
These plans assist manufacturers in quickly achieving their production goals and minimizing the cost incurred on the procurement.
While performing calculations of operating expenses, it pays special heed to the manufacturing capacity of the production plant.
Automatic initiation of the Material Requirements Planning management process and generation of the purchase order take place soon after the production orders’ analysis and approval.
Aside from all these implications, it acts as a protective barrier against shortages, unexpected scheduling snafus, and inefficient allocation of resources.
Seven Proven Steps for Creating Great MPS
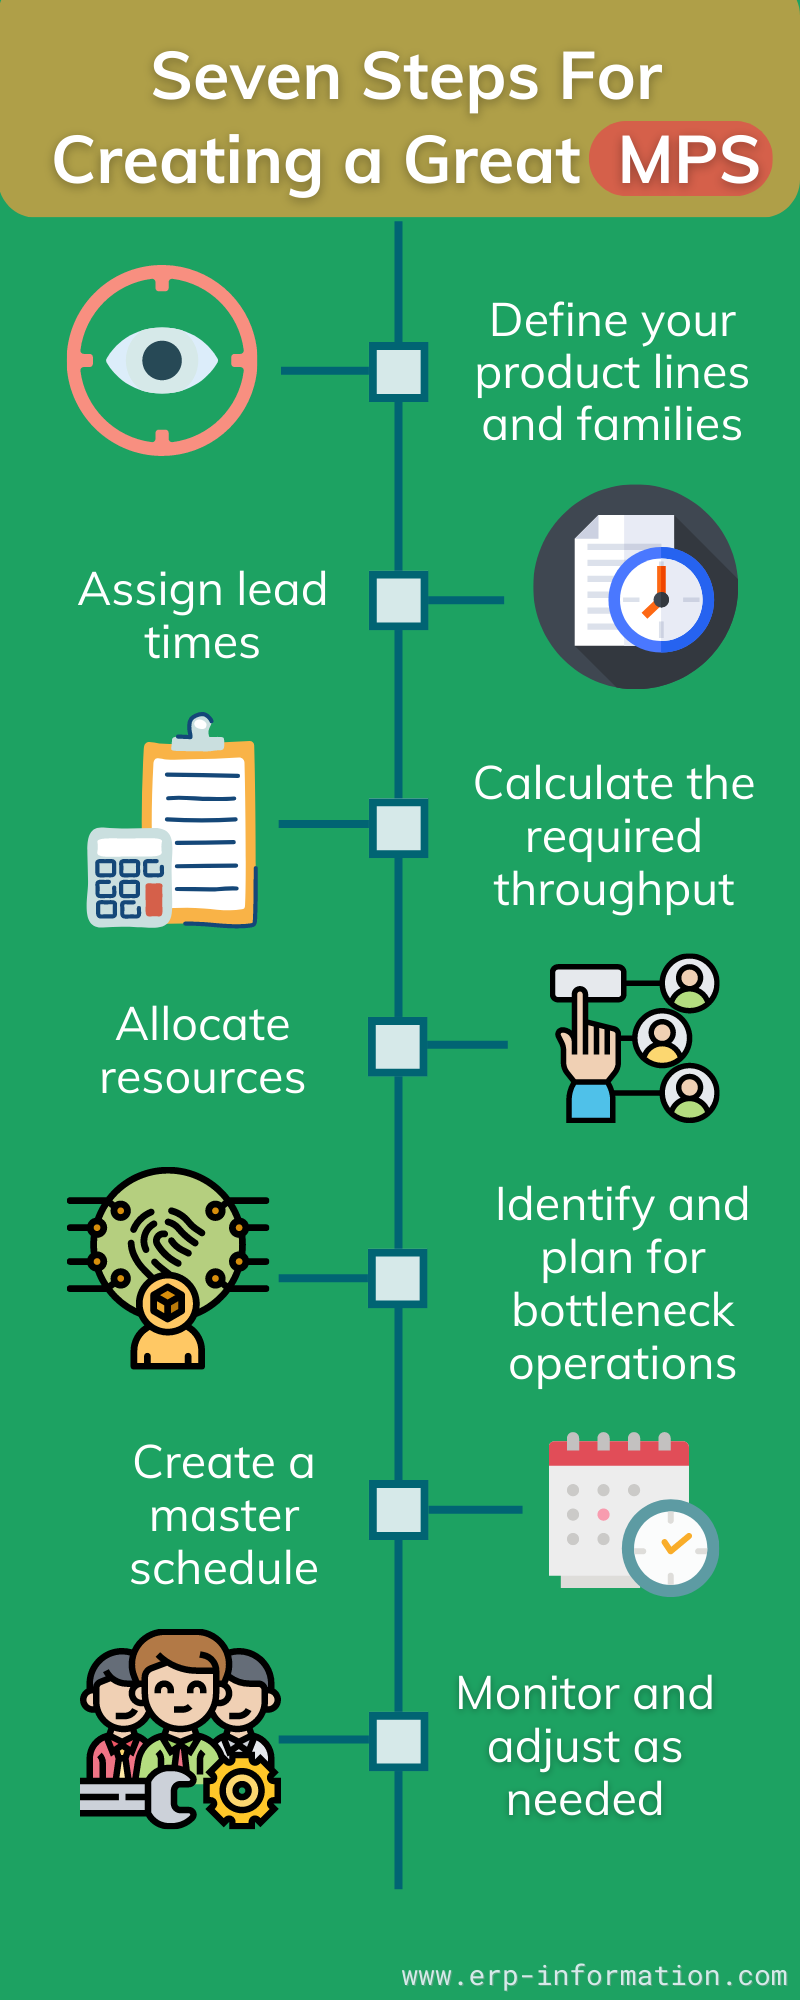
1. Define your product lines and families
Product lines represent different categories of products, while product families represent similar products within a line. You’ll need to define both to create an accurate MPS.
2. Assign lead times
Lead times are the time it takes from when you place an order until you receive the product. You’ll need to know this information to calculate your required throughputs (more on that later).
3. Calculate the required throughput
The required throughput is the number of products you must produce daily to meet customer demand. This figure can vary depending on your business and production needs, so it’s important to calculate it accurately.
4. Allocate resources
Once you know the throughputs needed for each product line/family, you’ll need to allocate the necessary resources (staff, equipment, etc.) to meet those demands.
5. Identify and plan for bottleneck operations
A bottleneck operation is an area of your production process that’s unable to meet customer demand. You’ll need to identify these areas and determine how much additional capacity you need to meet demand.
6. Create a master schedule
This is where the real work of creating an MPS begins. Using steps one through five information, create a master schedule that shows when the company will produce each product line/family.
7. Monitor and adjust as needed
As with any plan, your schedule will require regular monitoring and adjustment to meet your business needs. So make sure to revisit the previous step regularly to ensure that your master schedule is up-to-date.
Following these seven steps, you can create a master production schedule to help your business run more smoothly and efficiently.
How far ahead the MPS has to run
The most common way to get a master production schedule wrong is to make it too short. There is a firm rule for the minimum, and it is not a matter of preference: the planning horizon must be at least as long as the cumulative lead time of the longest-lead item you build. Cumulative lead time means the whole chain added end to end, not the final assembly step alone, so it includes procurement of the slowest purchased component, every stage of manufacture, and design time where the product is engineered to order.
The reason is mechanical. MRP explodes the MPS through the bill of material and offsets each level by its lead time. If a product takes 14 weeks from raw material order to finished goods and the schedule only extends 8 weeks, the first six weeks of component demand simply do not exist yet when the buyer needs to act on them. The schedule will look tidy and still generate shortages, because the requirement appeared later than the time needed to satisfy it.
In practice most master schedules run somewhere between three and eighteen months. Where a given plant lands inside that range is decided by its own longest cumulative lead time rather than by convention. Two useful checks: extend the horizon far enough that the far end is beyond the point where any current commitment can still bite, and be honest that periods out there are planning placeholders, not promises.
Inputs to MPS
Following is the list of inputs,
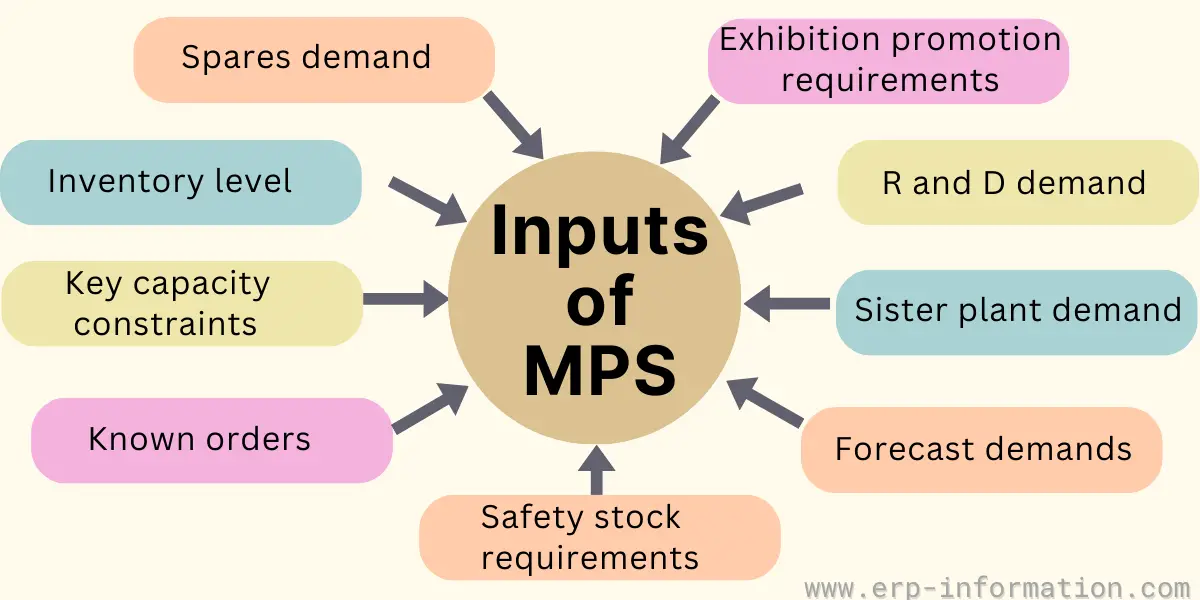
- Forecast demands
- Known orders
- Key capacity constraints
- Inventory level
- Spares demand
- Safety stock requirements
- Exhibition promotion requirements
- R & D demands
- Sister plant demand
Different Methodologies for Master Production Scheduling
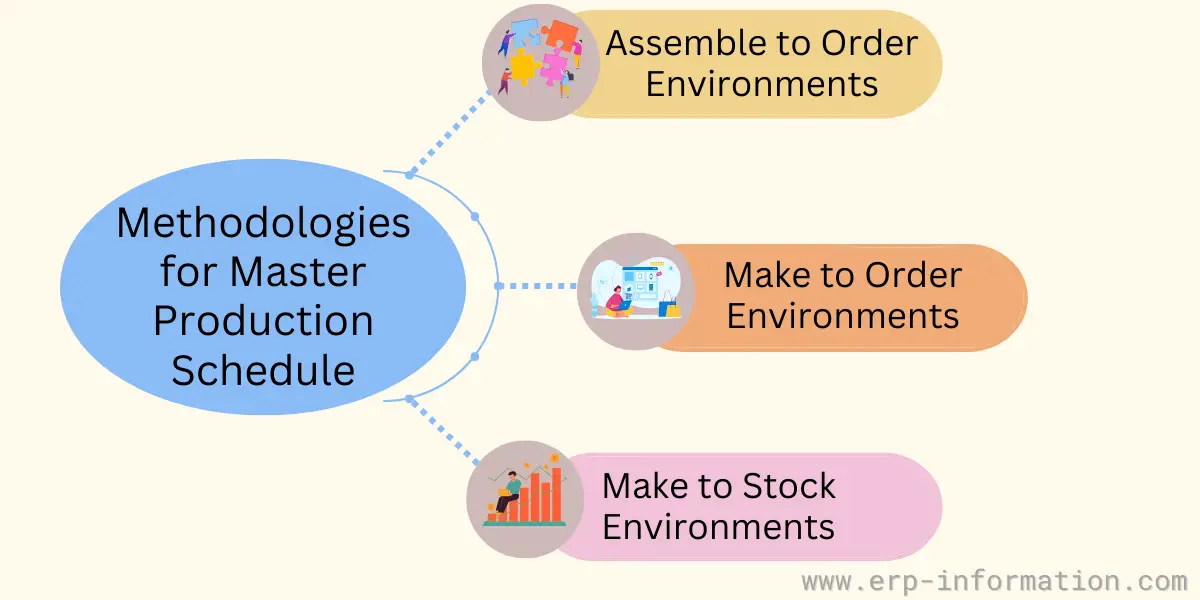
We call it master production schedule techniques also. The production schedule decides how to make things using all the resources that are currently available. Therefore, if too many items are in the MPS, it won’t work for those who make things.
Another problem is that if the MPS doesn’t have enough details, then there might not be enough things made. Usually, you can only use a Master Production Schedule if there aren’t too many product choices.
Make-to-Stock Environments
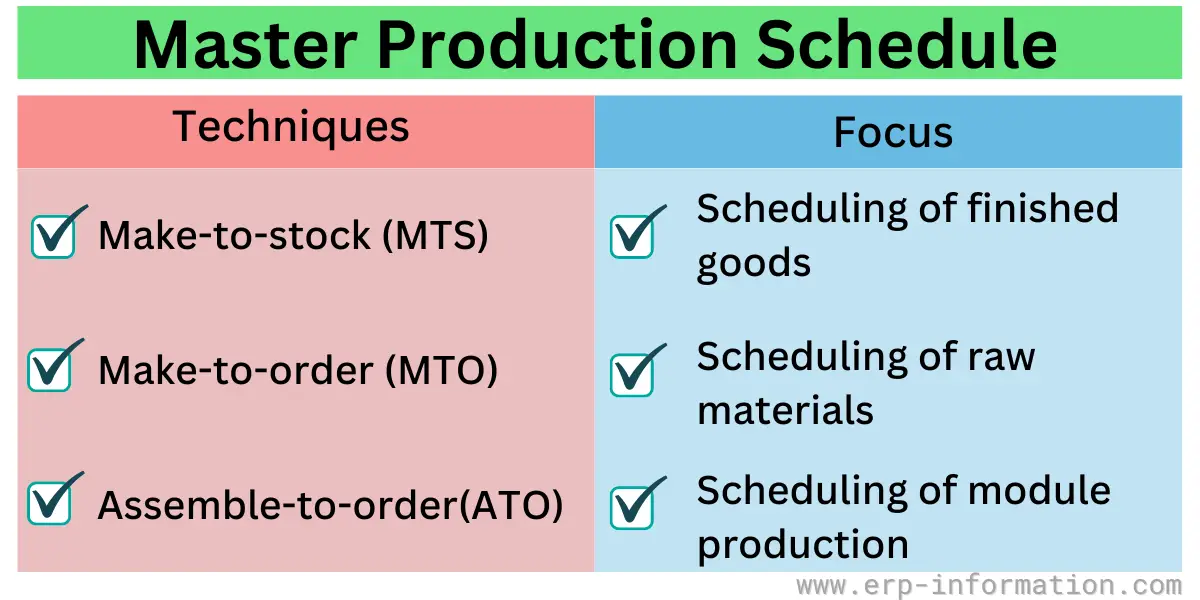
In a make-to-stock operation, finished goods are built to a forecast and held in stock, ready to ship the moment an order arrives. The MPS is set at the finished-goods (end-item) level, because that is exactly what you are building ahead of demand.
Make-to-Order or Build-to-Order Environments
In a make-to-order operation, nothing is built until a customer order arrives. Because each finished item is configured to the order, the MPS is usually set lower down, at the level of the long-lead-time components or raw materials, so they are on hand when an order lands.
The main aim of the Master Production Schedule in the Make-to-Order environment would be the periodic arrangement of the actual customer orders.
Assemble-to-Order Environments
Assemble-to-order environments utilize raw materials to produce subassemblies and essential components effectively. These components and sub-assemblies work in harmony to form various finishing goods. The Master Production schedule should emphasize the subassembly level in this technological environment.
MPS in each of these scenarios emphasizes the specific area.
Common Reports of MPS
Master production schedules are typically reported on to track and optimize goods manufacturing. These reports provide visibility into the current state of production and help identify issues or opportunities to better plan for the future.
Common master production schedule reports include Available-to-Promise, Demand Tracking Reports, Forecast Data Reports, Schedule vs. Actual Output Reports, and Build Schedule Reports.
- Available-to-Promise: The report provides a picture of available-to-promise quantities for every MPS item.
- Demand Tracking Report: Gives historical information on actual shipment and order bookings compared with management forecast.
- Forecast Data Report: It summarizes the difference between forecast and actual demand.
- Schedule vs. Actual Output: Compares actual output with the scheduled output of a specific work center.
- Build Schedule Report: Provides a report of the build schedule for all assemblies.
Benefits of Master Production Schedule
- It provides an effective and reliable communication skills conduit with the sales team to facilitate the planning process.
- Effectively reduce the time incurred in the manufacturing process throughout the year.
- It acts as an effective barrier against the shortage of raw materials and any unexpected mishap.
- Make necessary adjustments to address the demand fluctuation while reducing the waste properly.
- It managed the cost incurred on manufacturing on behalf of the business owner and made the most precise calculation about the raw material requirements.
- It enhances the overall efficiency in the location of production resources.
- It is a foundation to construct, improve, and track the sales forecast.
- It helps the organization’s account department reach income and expenses by providing account statements like profit & loss statements and balance sheets.
- It helps in the calculation of inventory levels.
Functions of MPS
A master production schedule is a plan rather than a piece of software. ERP systems hold it and recalculate it, but the functions below belong to the schedule itself, and they are worth separating from what the surrounding modules do.
- It turns an aggregate plan into specific end items. The production plan says how much of a product family to build over a month. The MPS says which individual finished items, in what quantity, in which week. That translation is its core job.
- It drives MRP. The MPS is the input MRP explodes through the bill of material to derive component and raw material requirements. Nothing downstream can be more reliable than the schedule feeding it.
- It gives sales a defensible answer on delivery. The available-to-promise line shows what is genuinely uncommitted in each period, so a delivery date can be quoted from the plan rather than from optimism.
- It states capacity demand in a form that can be tested. The schedule is what rough-cut capacity planning checks against the critical resources. Until that check runs, an MPS is a wish list.
- It stabilises the factory. By fixing near-term periods behind time fences, the MPS stops day-to-day demand noise from reaching the shop floor as constant rescheduling.
Two things the MPS is often credited with and does not do. It does not choose alternative production routes: routings live on the routing master, and selecting between them is the job of detailed scheduling or an APS tool, not of the master schedule. And it does not calculate material or capacity requirements itself. It supplies the demand signal that MRP and capacity planning then calculate from.
Master Production Schedule Example
The heart of an MPS is a simple grid: one row per figure, one column per period. Here is a worked example for a single make-to-stock product that starts with 30 units on hand and is built in lot sizes of 50.
| Row | Week 1 | Week 2 | Week 3 | Week 4 |
|---|---|---|---|---|
| Forecast | 20 | 20 | 20 | 20 |
| Customer orders (booked) | 25 | 15 | 5 | 0 |
| Projected available balance | 5 | 35 | 15 | 45 |
| Available-to-promise (ATP) | 5 | 30 | — | 50 |
| MPS (build quantity) | 0 | 50 | 0 | 50 |
Reading the grid:
- Projected available balance (PAB) carries stock forward. Each week it is the previous balance minus that week’s requirement (the greater of forecast or booked orders), plus any MPS build. In week 2, 5 minus 20 would fall to −15, so a lot of 50 is released, leaving 35.
- The MPS row is the output of the whole exercise: build 50 in week 2 and 50 in week 4, and nothing in weeks 1 and 3.
- Available-to-promise (ATP) shows how much is still free to sell before the next build. Week 2’s ATP of 30 is the 50 built minus the 20 already promised across weeks 2 and 3, so sales can safely commit 30 more units without breaking the plan. See available-to-promise for the full method.
Time fences: what you can and cannot change
Not every part of the schedule is equally open to change. Near-term periods sit inside a frozen zone where the plan is fixed, because material and capacity are already committed and changing them causes disruption and cost. Periods further out are slushy (changeable with trade-offs) and then liquid (fully open). Those boundaries are set by time fences, and respecting them is what keeps an MPS stable enough to rely on. The frozen zone is where this discipline matters most.
Those zone boundaries are set by two fences, and the distinction matters when you are reading an MPS. The demand time fence governs which demand the schedule counts, and the planning time fence governs what the system is allowed to reschedule on its own. One decides the inputs, the other decides the automation.
The consequence worth carrying into the grid above is this: inside the demand time fence, adding a forecast changes nothing, because only booked customer orders count that close in. If a schedule is not reacting to a forecast you just entered, check which side of that fence the period sits on before concluding the system is broken. Our guide to the frozen zone sets out both fences, the frozen, slushy and liquid zones, and who is allowed to authorise a change in each.
Difference Between MPS and Production Planning & Scheduling
| Master Production Schedule | Production Planning & Scheduling |
| Provides a high-level plan focused on what to produce, when, and in what quantities. It’s more strategic and long-term. | Offers a detailed plan of how to produce, covering the allocation of resources and the specific timing of tasks. It’s more tactical and short-term. |
| Focuses on fulfilling customer orders and balancing supply and demand at a macro level. | Focuses on the efficient use of resources and the smooth operation of the production process at a micro level. |
| Typically looks at weeks to months, providing a broad timeline for production activities. | Often looks at days to weeks, offering a more immediate and detailed timeline for manufacturing tasks. |
| More rigid, as it’s based on forecasted demand and customer orders which are less likely to change frequently. | More flexible, and capable of adapting to real-time changes and disruptions on the production floor. |
FAQs
What is the production schedule?
The production schedule is the sequence of steps or operations necessary to produce a product.
The production schedule for a chocolate bar, for example, might involve the following steps:
1. Obtaining cocoa beans
2. Roasting the beans
3. Grinding the beans into a powder
4. Adding sugar and other ingredients
5. Shaping the chocolate bars and
6. Packaging the chocolate bars.
What is meant by master scheduling?
Master scheduling is creating a master production schedule, a plan that outlines the organization’s production tasks and their associated timeframes.
A master schedule is created in manufacturing and production to plan how much of each product will be produced. The plan considers future demand, the availability of resources, and the organization’s production capacity.
Master scheduling takes the higher-level aggregate plan and turns it into a specific build schedule for individual end items. It sits directly below aggregate planning, not the same thing, and becomes the framework against which shorter-term daily and weekly plans are built. It also helps ensure that the organization produces only what it can sell without excess inventory.
How is production planning different from the master production schedule?
Production planning is the phase that comes before the master production schedule. Production planning defines the higher production level and tiny details.
Production planning determines how many products should be produced. But MPS defines and decides the number of products made in a given time.
Download MPS Templates
Five spreadsheets are available below. They are not five versions of the same thing, so it is worth knowing which one matches the job before downloading. Only the first is a time-phased master schedule in the sense used earlier on this page, with a period-by-period inventory projection. The others are planning and tracking sheets that sit around the master schedule.
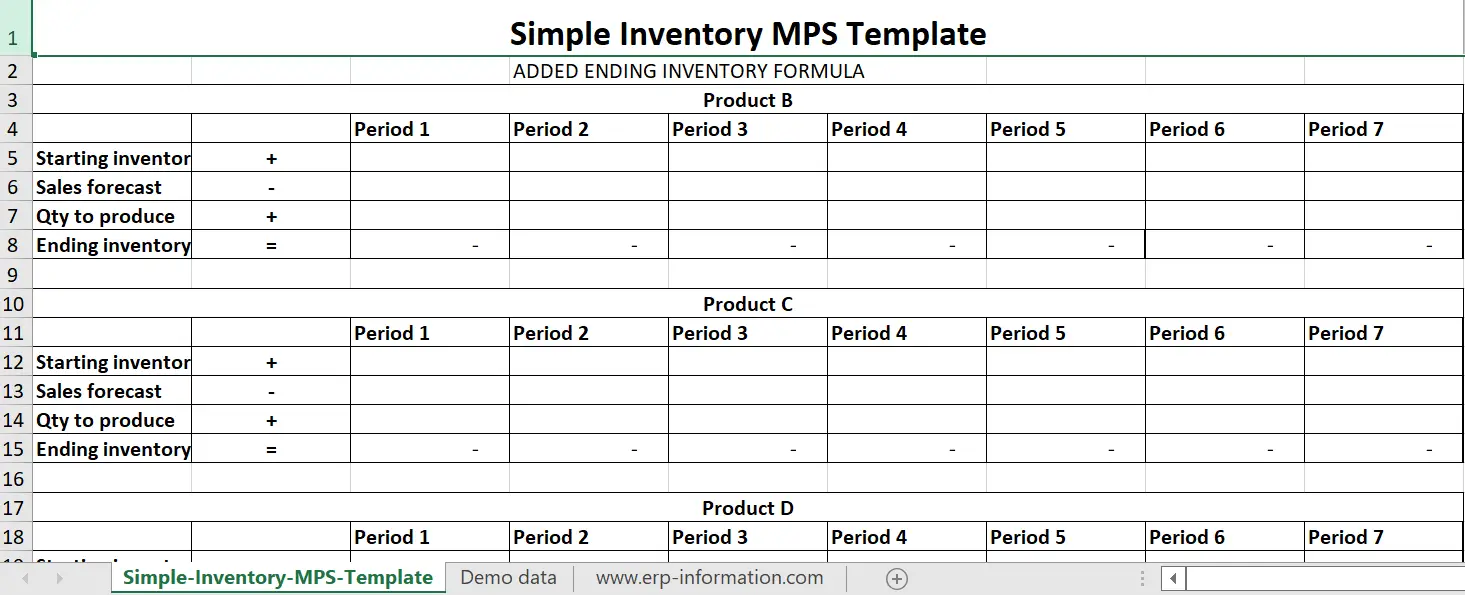
- Simple Inventory: the closest to a true MPS grid. Rows for starting inventory, sales forecast, quantity to produce and ending inventory, laid out across seven periods and repeated per product. Start here if you want the worked example above in a spreadsheet.
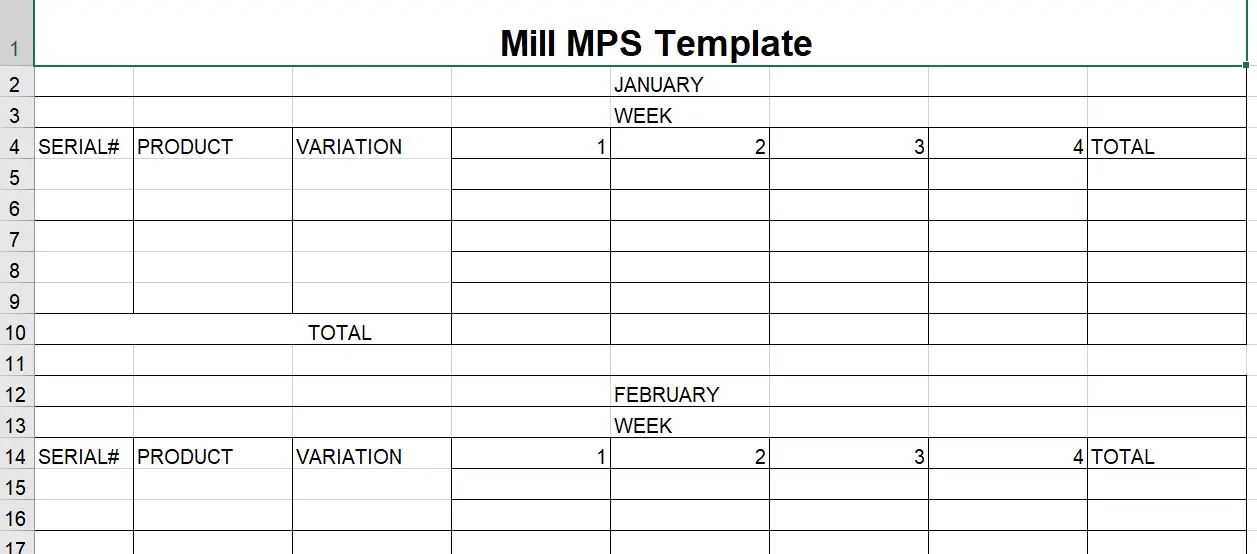
- Mill: a monthly build plan by product and variation, split into weekly columns with a monthly total. Suited to a plant scheduling a repeating product range week by week.
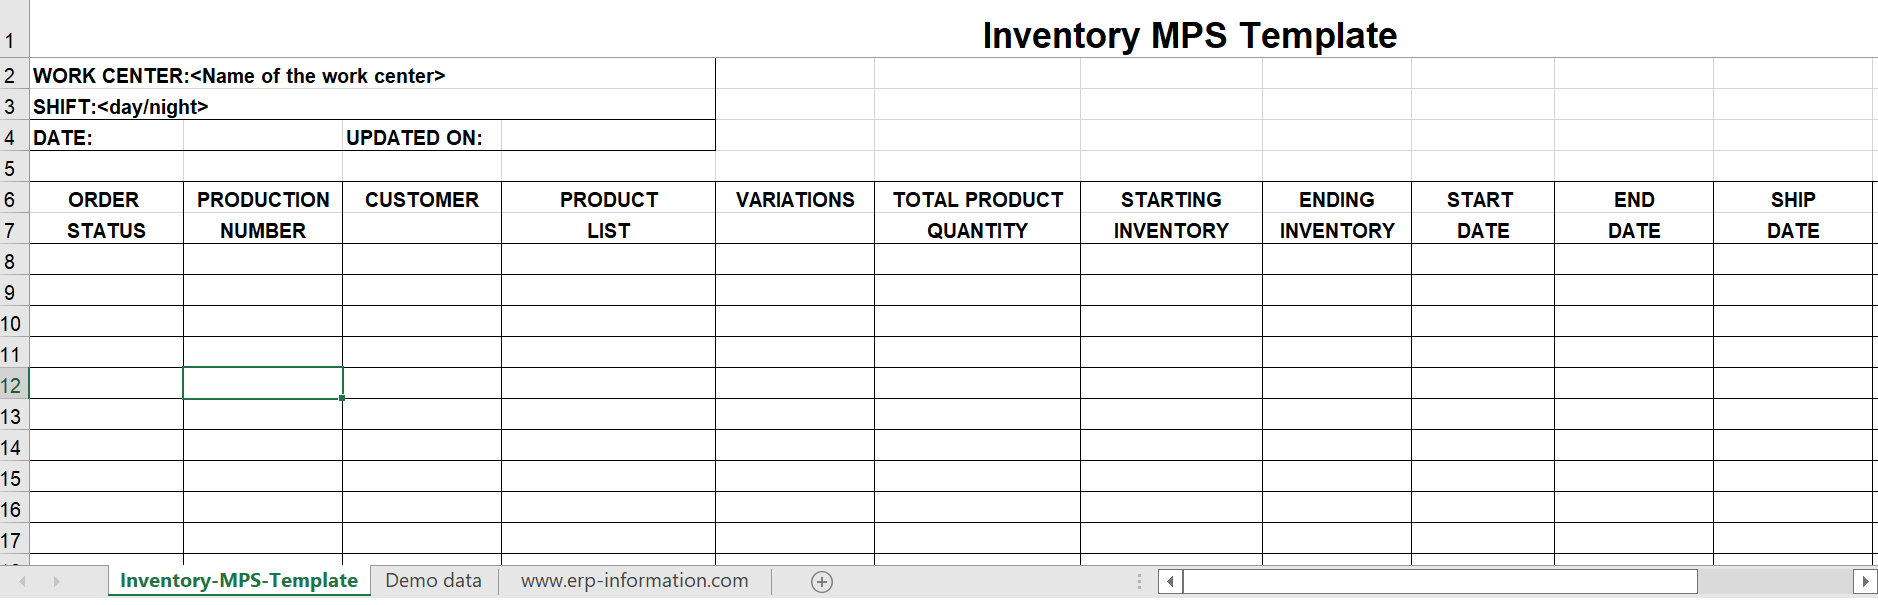
- General Inventory: a production order tracker rather than a forward schedule, with order status, production number, customer, quantities and start, end and ship dates. Useful for following orders already released.
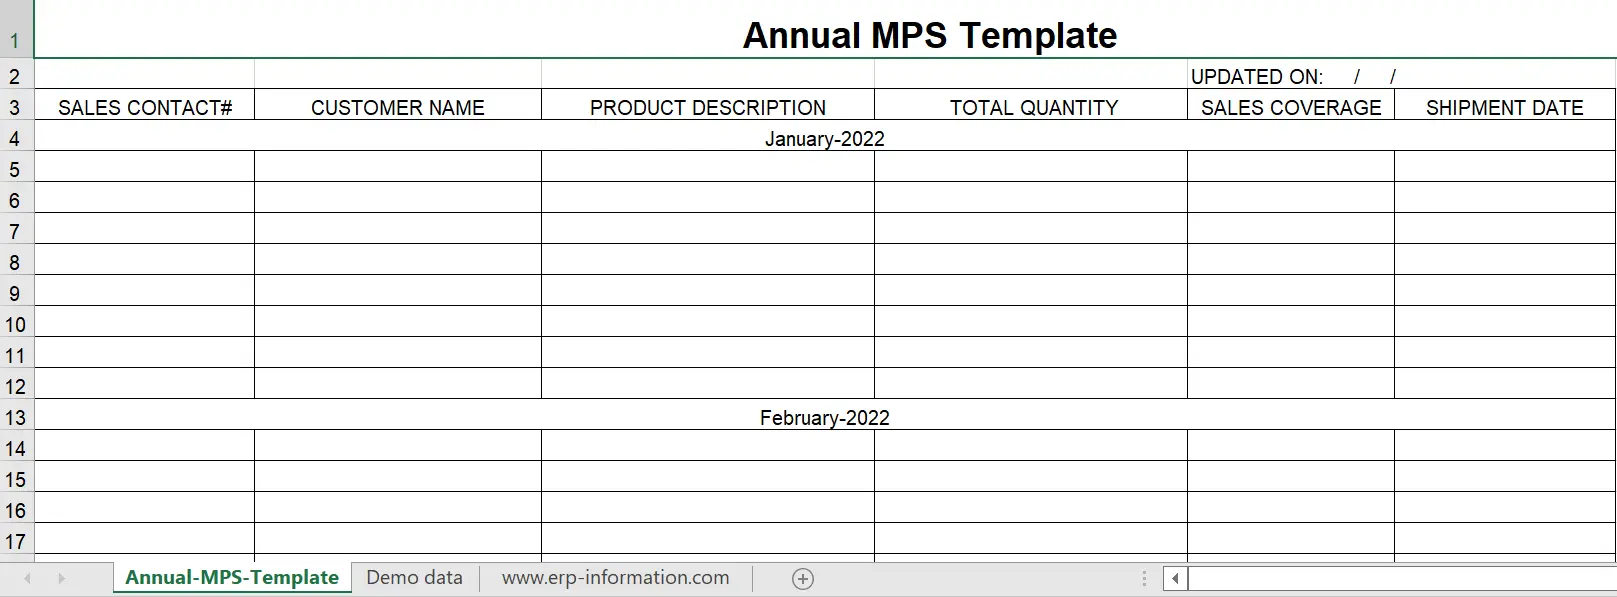
- Annual: a twelve-month customer commitment sheet listing sales contract, customer, product, total quantity and shipment date. It records what has been promised to whom, which is an input to the master schedule rather than the schedule itself.
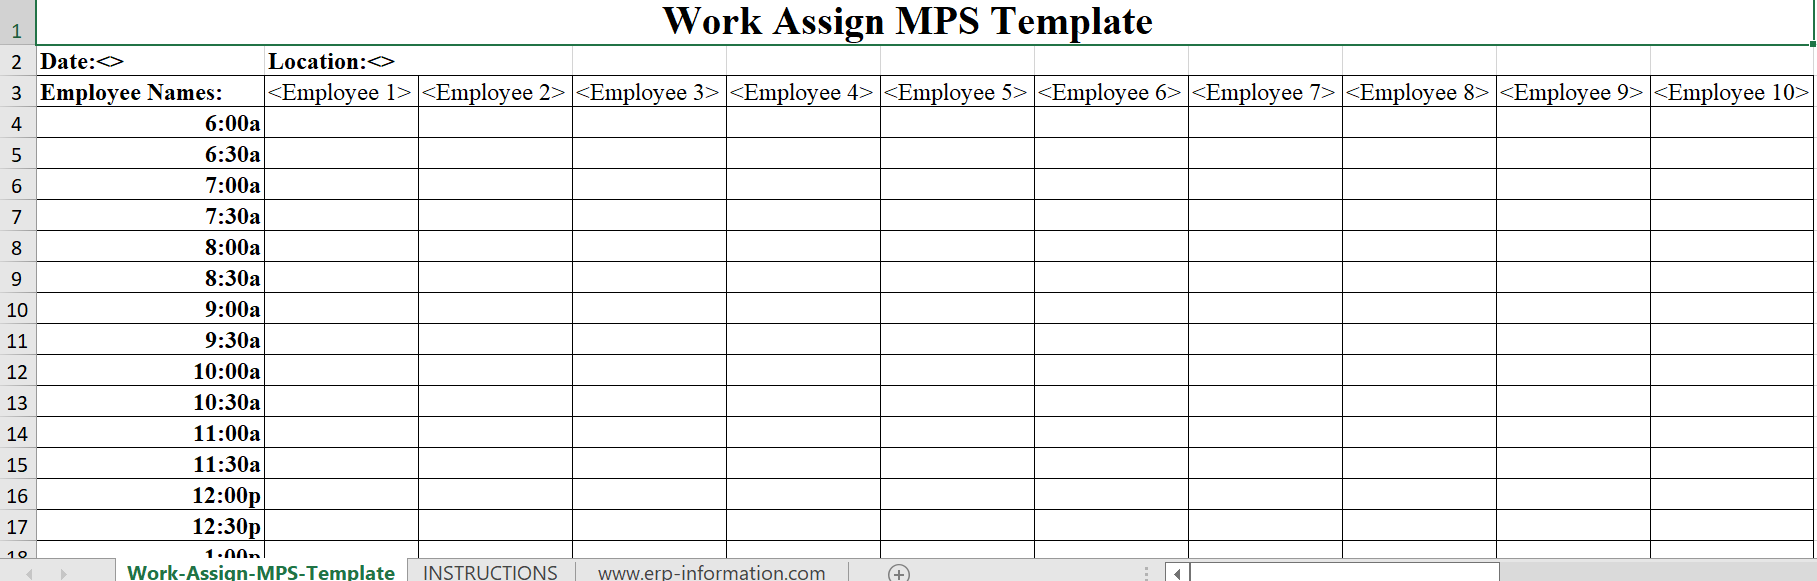
- Work Assignment: a daily staff roster, with employees across the columns and half-hour slots down the rows. It covers who is working when, not what is being built, so reach for it only if that is the gap you are filling.
Each workbook holds the blank template on its first tab and a filled demo on the second. Several open on the cover sheet, so if the first thing you see is a nearly empty page, use the tabs at the bottom to reach the template itself.
Simple Inventory Template
General Inventory Template
Annual Template
Work Assignment Template
Mill Template
Conclusion
The Master Production Schedule is vital to manufacturing because it helps to plan and organize production. It also calculates the resources needed for each production goal.
It helps identify problems that may occur with production. It can help forecast demand, predict future growth, manage inventory, and ensure orders are fulfilled on time.
Having an MPS makes it easier for a company to predict customer demand, leading to fewer stock shortages and improved customer service.
References: